
Figure 1.
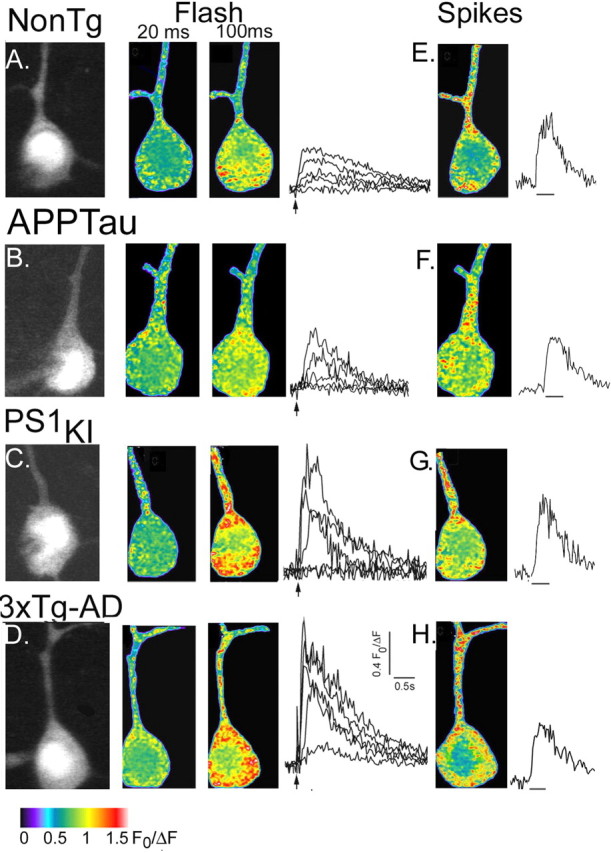
Imaging IP3- and spike-evoked Ca2+ signals in NonTg and Tg neurons. A, Fura-2 fluorescence in a neuron from a 6-week-old NonTg mouse. The left panel shows resting fluorescence (F0) levels. The middle panels show pseudocolored images of Ca2+ signals evoked after photolysis of caged IP3 (20 and 100 ms flash durations, as indicated). Each panel is an average of ∼10 sequential video frames around the time of maximal signal; different colors correspond to fluorescence ratio changes as indicated by the bar. Superimposed traces to the right show increasing somatic fluorescence ratio signals evoked by flashes of 10, 20, 30, 50, and 100 ms. Ca2+ signals were measured from the soma (excluding the nucleus). B–D, Corresponding Ca2+ images and traces obtained, respectively, in a representative 6-week-old APPTau neuron, a 6-week-old PS1KI neuron, and a 6-week-old 3xTg-AD neuron. E–H, Ca2+ images (average of 15 frames) captured during a train of action potentials and time courses of somatic Ca2+ signal during these action potential trains, from the corresponding neurons in A–D.