
Figure 2.
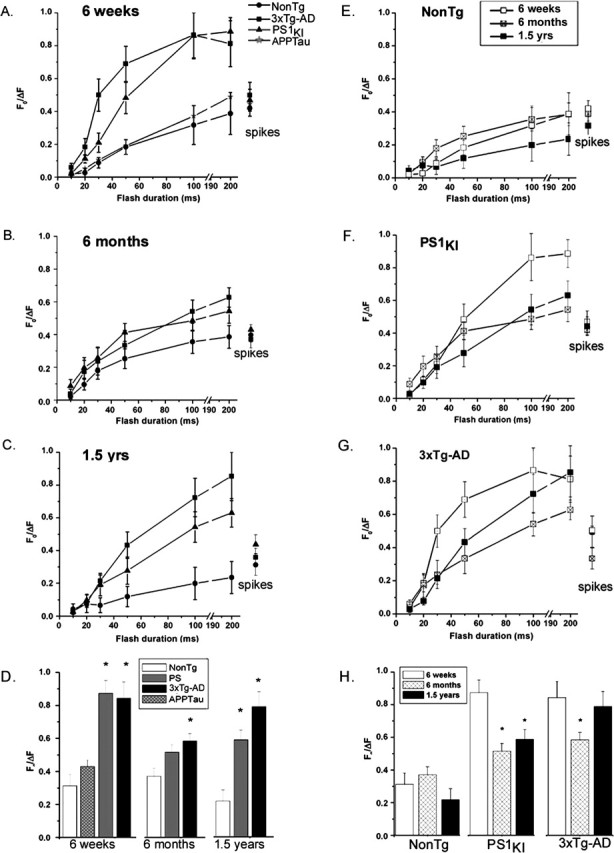
ER Ca2+ signaling remains elevated throughout the lifetime of PS1 mutant-expressing mice. Panels show identical data grouped by age (A–D) and by transgene (E–H). A, IP3-evoked Ca2+ signals in cortical neurons from NonTg (•), PS1KI (▴), 3xTg-AD (▪), and APPTau (★) mice at 6 weeks of age. Data points show mean fluorescence ratio changes evoked by photolysis flashes of increasing durations and (at right) signals evoked by trains of action potentials. B, Corresponding data from 6-month-old mice. C, Corresponding data from 1.5-year-old mice. D, Summary histograms, showing maximal IP3-evoked Ca2+ responses (pooled 100 and 200 ms flash data) for each of the transgenic groups at 6 weeks, 6 months, and 1.5 years of age. Asterisks indicate significant differences (*p < 0.05) from the NonTg controls within each age group. E–G, IP3- and spike-evoked Ca2+ signals grouped by transgene (respectively, in neurons from NonTg, PS1KI, and 3xTg-AD mice). In each panel, data points show mean responses from 6-week-old (□), 6-month-old (⊠), and 1.5-year-old (▪) mice. H, Summary histograms, showing maximal IP3-evoked Ca2+ responses (pooled 100 and 200 ms flash data) for each age within the different transgenic groups. Asterisks indicate significant differences (∗p < 0.05) from the response at 6 weeks within each transgenic group. Error bars represent SEM.