
Figure 5.
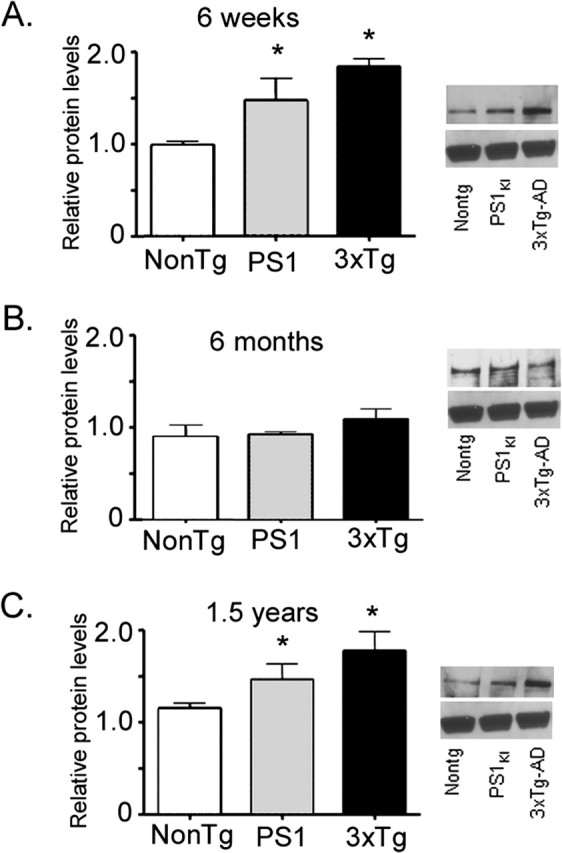
Expression levels of brain RyR protein at different ages and across transgenic groups. In each panel, histograms show mean (±1 SEM; n = 3 replicates) RyR immunoblot density relative to β-actin expression for NonTg (left), PS1KI (middle), and 3xTg-AD (right) brains. Asterisks mark significant (∗p < 0.05) differences from NonTg controls. Representative immunoblots of RyR protein (top) and representative β-actin levels (bottom) are shown at the right of each age tested. Data are shown from brains from 6-week-old (A), 6-month-old (B), and 1.5-year-old (C) mice.