Figure 6.
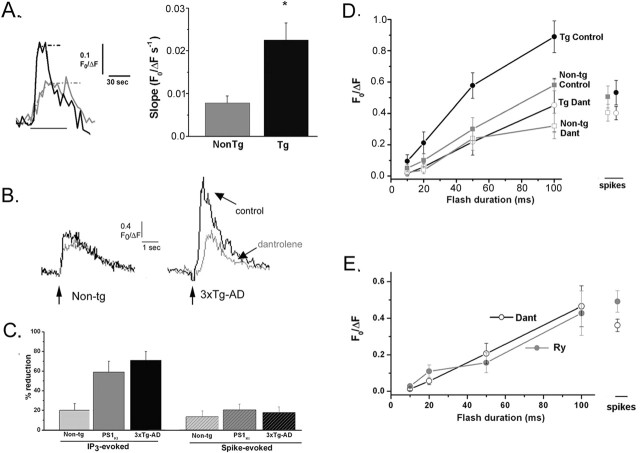
Caffeine-evoked Ca2+ liberation through RyR is potentiated in PS1KI and 3xTg-AD neurons. A, Superimposed traces at the left show representative Ca2+ signals evoked in the soma of NonTg (gray) and 3xTg-AD (black) neurons by bath application of 20 mm caffeine. Rates of rise were measured from the maximal slope of sigmoid curves fitted to the data (dashed curves). The bar graph at the right plots mean rates of rise of caffeine-evoked fluorescent signals in the soma of NonTg (gray bar; n = 10) and Tg (black bar; n = 9) neurons. B, IP3-evoked Ca2+ signals are reduced by the RyR blocker dantrolene. Traces show Ca2+ responses evoked by a 50 ms flash in control conditions (black) and in the presence of bath-applied dantrolene (gray) in representative NonTg (left) and 3xTg-AD (right) neurons. C, Mean percentage reductions in amplitudes of IP3-evoked Ca2+ responses (50 ms flash duration) and spike-evoked Ca2+ signals resulting from application of dantrolene (10 μm) in NonTg (n = 6), PS1KI (n = 6), and 3xTg-AD (n = 7) neurons. D, Effect of dantrolene on the dose–response relationship of IP3-evoked Ca2+ signals. Points show measurements from NonTg neurons (n = 12; squares) and pooled measurements from 3xTg-AD and PS1KI neurons (Tg, n = 25; circles) before (filled symbols) and after (open symbols) applying dantrolene. Data at the right show respective spike-evoked Ca2+ signals. E, Filled symbols show mean amplitudes of IP3- and spike-evoked Ca2+ signals measured from pooled Tg neurons (n = 12) with ryanodine (30 μm) included in the pipette solution). For comparison, open symbols reproduce the measurements in C from Tg neurons exposed to dantrolene. Error bars represent SEM.

