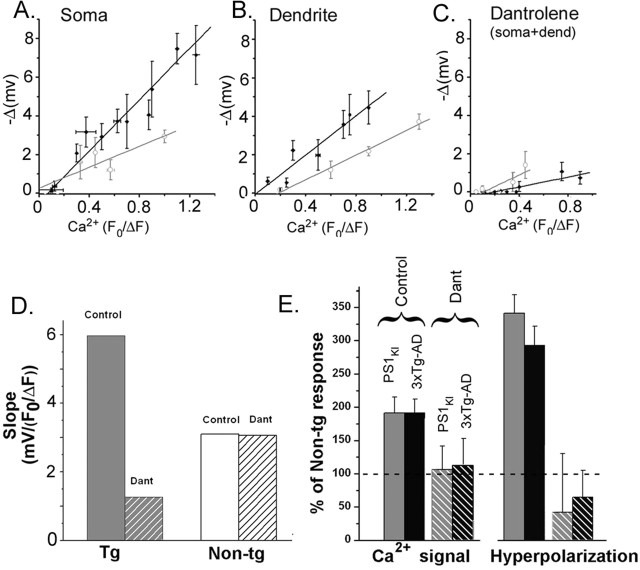
Figure 8.
The relationship between the IP3-evoked Ca2+ signal and membrane hyperpolarization is steeper in Tg than in NonTg neurons. A, Scatter plot showing the relationship between IP3-evoked Ca2+ signal in the soma and the magnitude of the accompanying membrane hyperpolarization in neurons from NonTg mice (n = 14; open symbols; gray line) and Tg mice (n = 23; closed symbols; black line). Points show means ±1 SEM obtained after binning over selected ranges of fluorescence amplitudes. B, Corresponding data for measurements in the proximal dendrites. C, Corresponding data in dantrolene (10 μm) obtained after pooling data from soma and dendrites. D, Dantrolene strongly reduces the slope of the relationship between IP3-evoked membrane hyperpolarization and Ca2+ fluorescence signal in Tg neurons but has negligible effect in NonTg neurons. Slope data were derived from the plots in A–C. E, Bar graphs show the amplitudes of IP3-evoked Ca2+ signals (left) and membrane hyperpolarizations (right) in Tg neurons as percentages of those in NonTg neurons (dashed line). Data are shown for PS1KI (gray) and 3xTg-AD neurons (black) before (solid bars; n = 55 and 81, respectively) and after (striped bars; n = 20 and 31) adding dantrolene.

