
Figure 5.
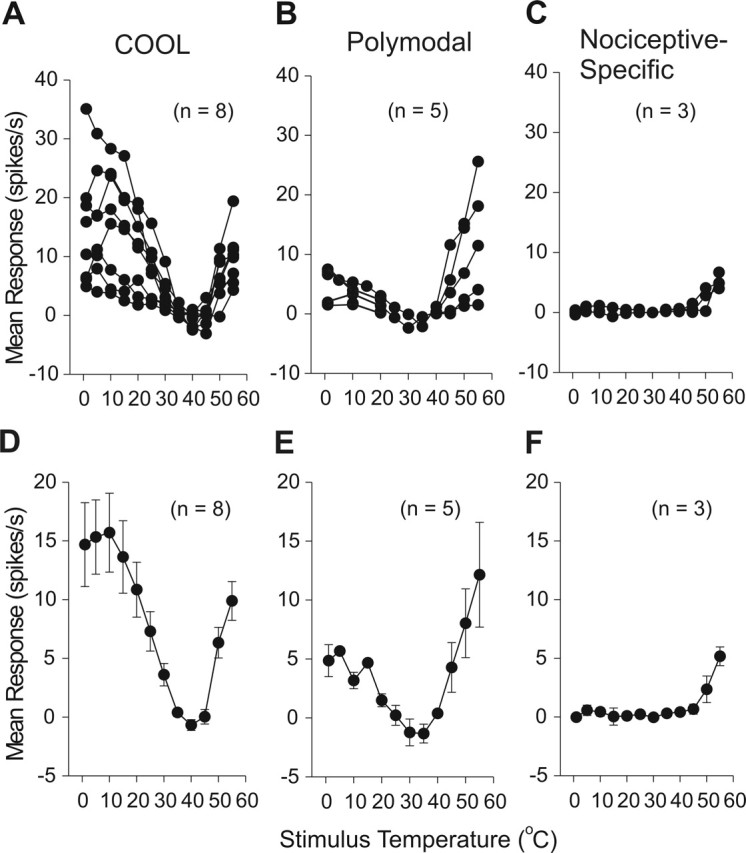
Stimulus–response plots for thermally identified subgroups of marginal zone neurons. A, Individual responses of COOL-type neurons to noxious heat, cool, and noxious cold stimuli. B, Polymodal nociceptive neurons responded in a graded manner to noxious heat and cold stimuli. C, Nociceptive-specific neurons responded only to noxious heat. Mean ± SE stimulus–response curves for COOL (D), polymodal (E), and nociceptive-specific-type (F) cells.