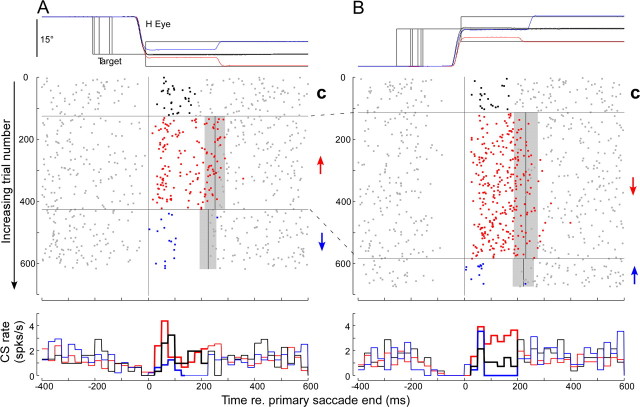
Figure 4.
Occurrence of CSs throughout each trial during different blocks of saccade adaptation for a representative P-cell. A, Leftward target steps. B, Rightward target steps. In both columns, the top panels show the time course of a representative eye movement during control saccades (black) and during rightward (blue) or leftward (red) errors aligned on the end of the primary saccade. The middle panels show the CSs (dots) associated with >600 trials in each direction plotted from top to bottom according to the progression of the experiment. In both columns, trials 1 to ∼120 are controls (C) with no adapt steps (CSs in error interval shown black). At trial ∼120, leftward saccades caused a forward adapt step (↑) and rightward a backward adapt step (↓), so errors were always leftward (CSs in error interval shown red). At trials ∼420 to the left and ∼580 to the right, left saccades caused a backward adapt step (↓) and right saccades a forward adapt (↑) step, so all errors were rightward (CSs in error interval shown blue). The gray bars indicate the SDs of the mean onset (solid vertical lines) of the corrective saccades within each adaptation block. Bottom panels show average histograms (25 ms bins) of all of the trials within each data block (thick line histogram colors correspond to those of CSs in error intervals above). For a complete explanation, see Results. This neuron was recorded at the center of the chamber, which was aligned along the midsagittal plane.

