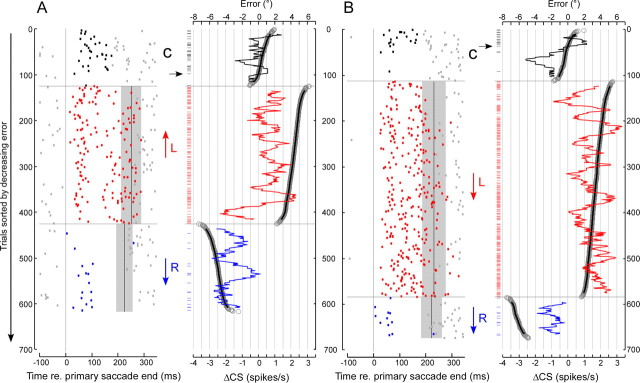
Figure 6.
Comparison of running averages of the change of CS rate relative to baseline (ΔCS) and of the error for the P-cell shown in Figure 4 with the trials sorted according to decreasing error amplitude. A, Leftward primary saccades. B, Rightward primary saccades. Left panels use the same data as those between −100 and +350 ms in A and B of Figure 4. Right panels show the 20-trial running average of CS rate relative to baseline within the intrasaccadic interval (ΔCS; Eq. 1) (fluctuating curves) and the error for each saccade (gray circles) as well as its 20-trial running average (Eq. 2) (thick black curve). Short horizontal tick lines (left of right panels in A and B) show trials in which one or more CS occurs within the error interval. Horizontal arrows in A and B indicate when the error crosses 0. Note that 0 error crossing coincides with the time when CS suddenly stops firing. C, Control; L, leftward error; R, rightward error.

