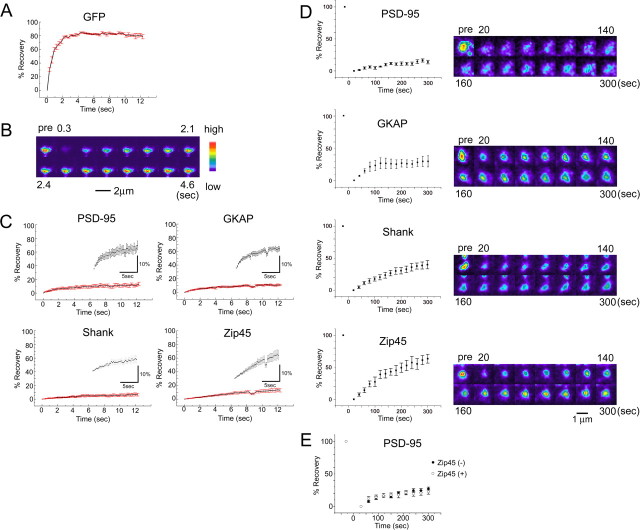
Figure 2.
FRAP analysis of EGFP and EGFP/EYFP-tagged scaffolding molecules. A, Fluorescence recovery curve of EGFP molecules after photobleaching of a single dendritic spine. B, Fluorescence images of an EGFP-filled dendritic spine during FRAP analysis. Scale bar, 2 μm. C, Fluorescence recovery curve of EGFP/EYFP-tagged scaffolding proteins within 12 s after photobleaching. The insets show the same plots with an enlarged vertical scale. D, Fluorescence recovery curve of EGFP/EYFP-tagged scaffolding proteins within 5 min after photobleaching. The baseline of fluorescence recovery was set to t = 20 s to eliminate the diffusible fraction identified in fast FRAP experiments shown in C. Scale bar, 1 μm. E, Fluorescence recovery curve of EYFP-tagged PSD-95 with or without ECFP-tagged PSD-Zip45. The presence of ECFP-tagged PSD-Zip45 did not alter dynamics of EYFP-tagged PSD-95. Error bars indicate SEM.

