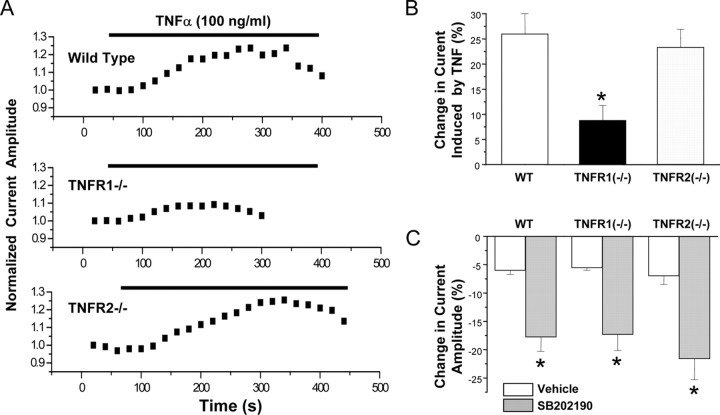
Figure 7.
TNFR1 mediates the TNFα-induced modulation of TTX-R Na+ currents. A, Representative time courses of the peak TTX-R current showing the effect of bath application of TNFα in DRG neurons prepared from WT, TNFR1–/–, or TNFR2–/– mice. B, Mean ± SEM percentage change of TTX-R peak currents induced by TNFα in TNFR1–/– and TNFR2–/– DRG cells compared with wild type. C, Mean ± SEM percentage change of TTX-R peak currents induced by the p38 inhibitor SB202190 (10 μm) in TNFR1–/– and TNFR2–/– DRG cells compared with wild type.

