
Figure 3.
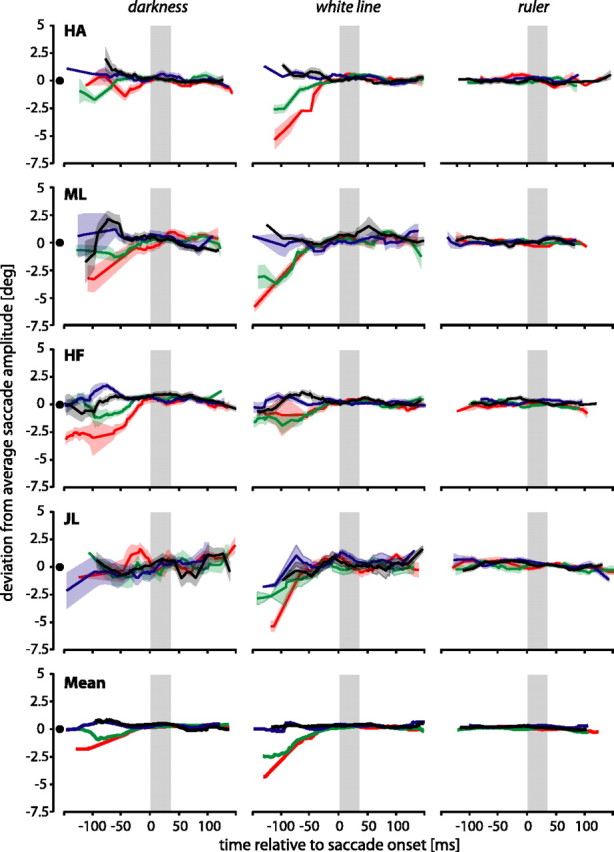
Deviations of saccade amplitude from average saccade amplitude when bars were flashed at various times relative to saccade onset. The colors of the curves indicate the position of the flashed bar (same conventions as in Fig. 2). The x-axis shows the presentation time of the flashed bar. The y-axis shows the deviation of a particular saccade from average saccade amplitude.