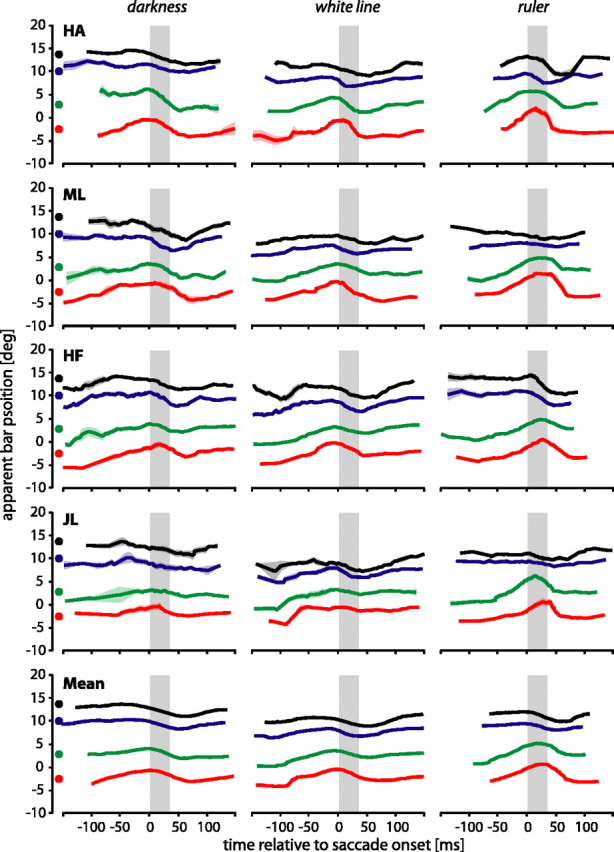
Figure 4.

Perceived bar positions for the four subjects in the darkness (left), white line (middle), and ruler (right) conditions. Individual curves show a sliding mean with a temporal window of 40 ms. The surrounding shaded areas show the corresponding SE. Colors correspond to the real bar positions at –2.6° (red), 2.6° (green), 10° (blue), and 13.6° (black). The real bar positions are indicated by color-filled circles next to the ordinate. Gray bars show the mean saccade duration.
