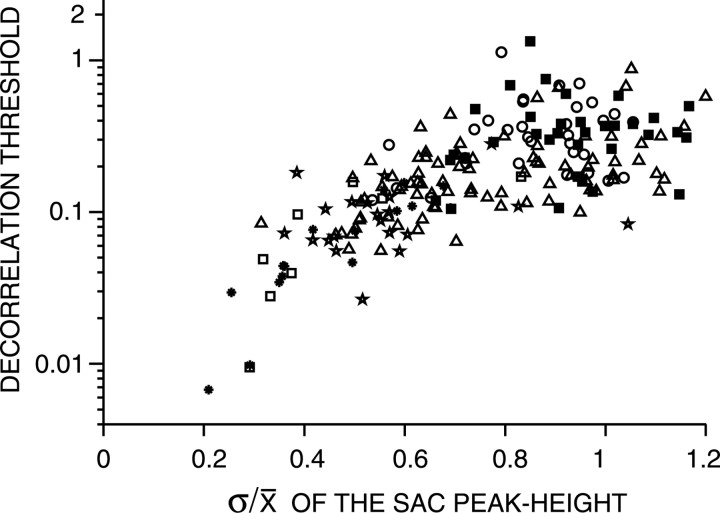
Figure 16.
Decorrelation thresholds obtained from broadband noise plotted versus the ratio of the SD to the mean of the coincidence counts of the correlogram for ρ = 1, at delay τ = 0. The thresholds were obtained with W = 5 ms. Fibers studied at multiple SPLs contribute multiple data points. Same symbols as in Figure 6.

