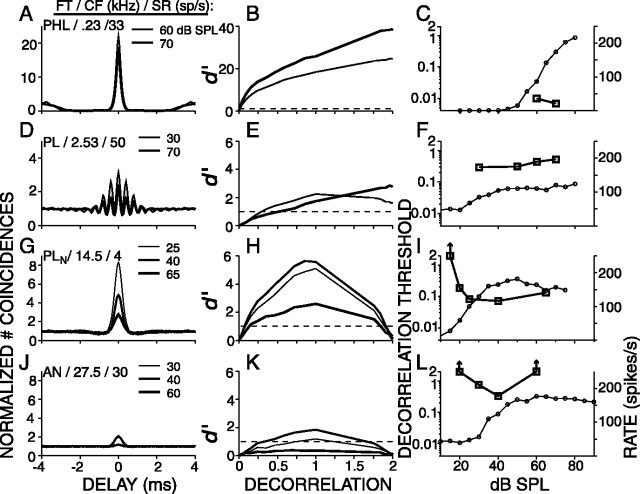
Figure 7.
Examples of SPL dependence for four fibers. Left, Correlograms at different SPLs, indicated in the right top corner of each panel. Also indicated are the fiber type (FT), CF, and SR. Middle, CSCs of the same data. The dashed horizontal lines are at d′= 1. Right, Each panel has two ordinates: the right ordinate indicates rate (circles, linear scale), and the left ordinate indicates decorrelation thresholds (squares, logarithmic scale). Note that the fiber of the first row is the same as in Figure 5.

