
Figure 2.
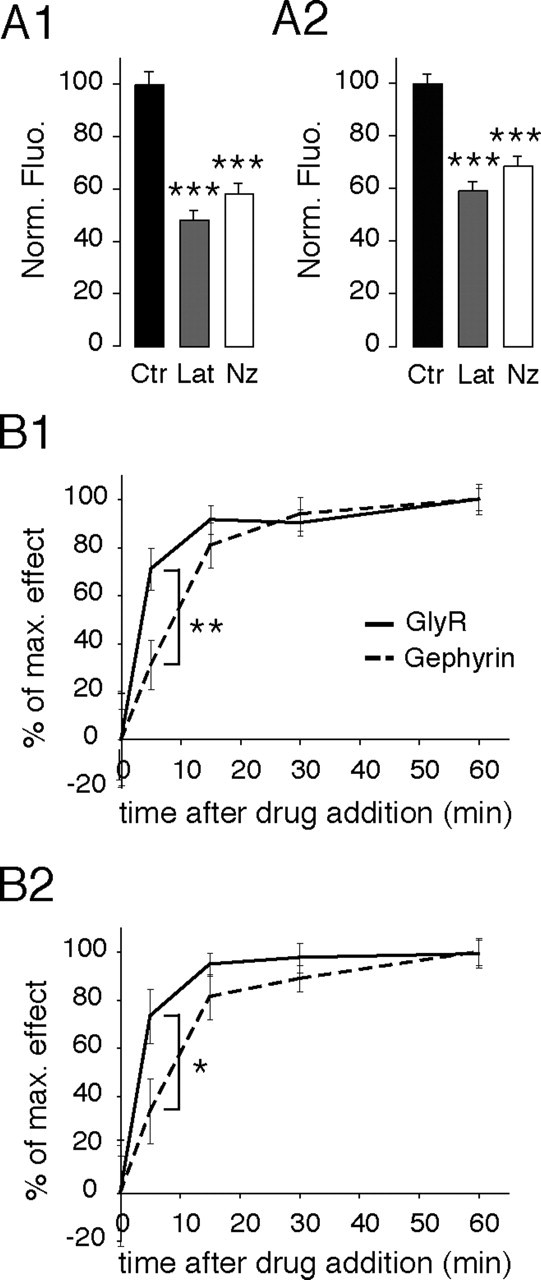
Decrease of GlyR- and gephyrin-associated fluorescence at synapses after F-actin and microtubule disruption. A, Normalized intensity of GlyR- (A1) and gephyrin- (A2) associated fluorescence at synapses, expressed as percentage of control, in control conditions (Ctr) (black), or after 1 h treatment with Lat (gray) or Nz (white). GlyR- and gephyrin-associated fluorescence significantly decreased in the presence of latrunculin or nocodazole. Values are averages ± SEM. ***p < 10−4, ANOVA, PLSD test. B, Time course of latrunculin (B1) and nocodazole (B2) effects on GlyR (full line) and gephyrin (dashed line) synaptic cluster fluorescence intensity. The effects of latrunculin and nocodazole treatments on GlyR-associated fluorescence precede those on gephyrin. Values (mean ± SEM) are expressed as the percentage of the maximum effect. In all cases, 18–23 cells from two independent cultures were analyzed 0, 5, 15, 30, and 60 min after the addition of the drug. *p < 5 × 10⁻², **p < 10−2, Mann–Whitney test.