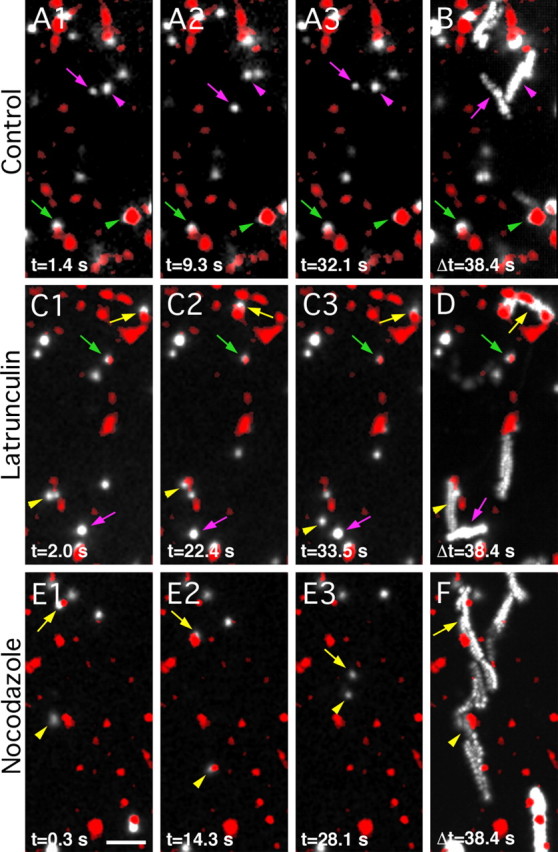
Figure 3.

Effects of F-actin or microtubule disruption on GlyR lateral diffusion. Examples of GlyR SPT recordings in cultured spinal cord neurons (10–12 DIV) in control conditions (A, B), or after 1 h incubation with latrunculin (C, D) or nocodazole (E, F). Active presynaptic terminals were labeled with FM4-64 (red). GlyRs were immunodetected with QDs (GlyR-QDs) (white). A1–A3, C1–C3, E1–E3, Sequences of pictures extracted from a recording at the indicated times. B, D, F, Maximum intensity projections emphasizing the surface area explored by GlyR-QDs during a 38.4 s recording sequence. Note the differences in the explored surface area and the transitions between synaptic and extrasynaptic compartments in control, latrunculin, and nocodazole conditions. Symbols: arrows, arrowheads, and crossed arrows are for identified GlyR-QDs; colors: green and purple, synaptic and extrasynaptic GlyR-QDs, respectively; yellow, GlyR-QDs swapping between the synaptic and extrasynaptic compartments. Scale bar, 5 μm.
