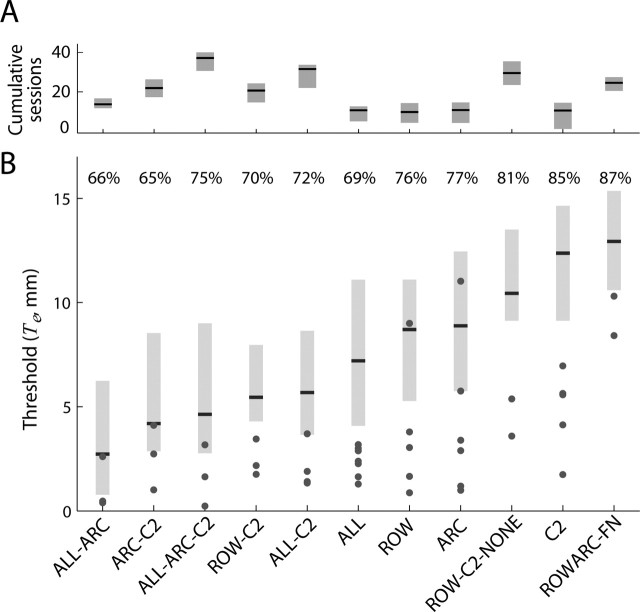
Figure 10.
Horizontal localization performance. A, Cumulative number of training sessions for each whisker configuration. Black horizontal lines indicate the mean cumulative session number averaged. The gray boxes indicate the range of cumulative sessions in the different groups; lower and upper ends indicate the smallest and largest cumulative session, respectively, averaged across rats in that group. B, Distributions of Te across all steady-state sessions of all rats for a given whisker configuration. Black lines indicate the median Te, and the lower and upper end of the gray bars indicate the first and third quartiles, respectively. The lowest Te reached by each individual rat is indicated by · for all whisker configurations. Numbers above bars indicate the median Le computed in sessions (see Fig. 3, Eq. 6). The range of these numbers (65–87%) entails average success rates of 57–68% (Eq. 5). These low rates result from the staircase method of stimulus presentation with presentations close to sensory threshold T, in which near-chance performance is expected.

