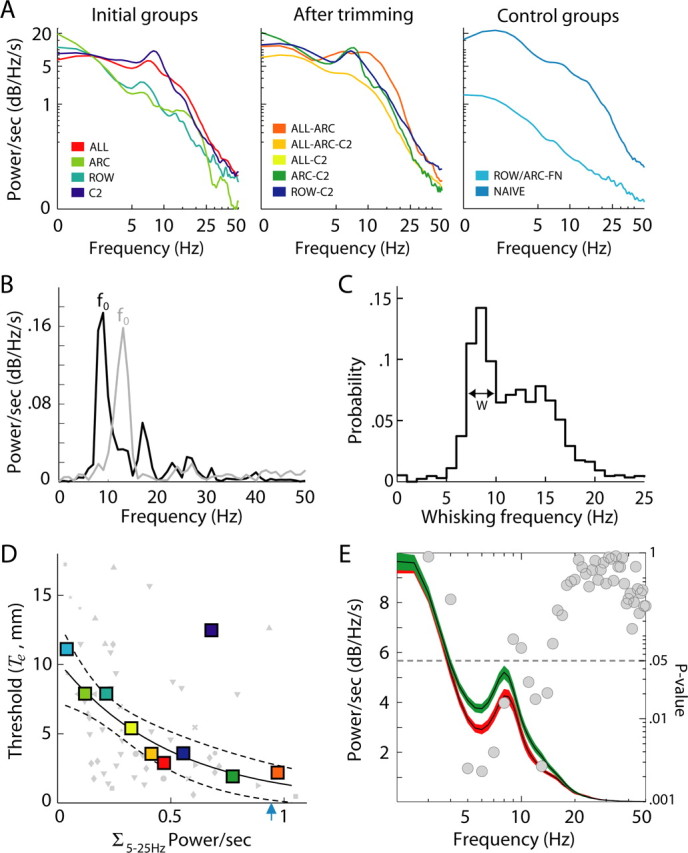
Figure 12.

Whisking and performance. A, PSDs of whisker angle during task performance. PSDs (power per second) were computed for individual trials, normalized with respect to time, and averaged. Trials (44–783) of two, three, or four rats were tracked for each condition (total of 62 min). B, PSDs of angular velocities of the whisker trajectories depicted in Figure 8, C (black) and D (gray). The whisking frequency is defined as the peak of the PSD (f0). C, Probability distribution of whisking frequencies of rats localizing objects (data from all whisker configurations; n = 1945). Trials were excluded if the maximal value of the PSD was less than its mean + 2 SDs. D, Acuity and net power (power per second) in the range of 5–25 Hz. Colors indicate whisker configuration (same as in A). Small symbols show the average power computed across trials of an individual testing session and its threshold. Large symbols show the average power and threshold computed across all trials and sessions of a configuration. The solid line shows the best fit of the exponential function α × e−βP to the data points of individual sessions, and dashed lines show its 95% confidence interval. The C2 configuration, based on its position after averaging across sessions, was considered an outlier and not included in the fit. The blue arrow indicates the average whisking power of naive rats. E, PSDs of whisker angles of all trials averaged across whisker configurations, except C2, according to trial outcome. Incorrect trials are shown in red, and correct trials are in green. The two PSDs were compared at 1 Hz bins (Wilcoxon’s test); gray circles indicate the p values of the differences. The dotted line indicates the 0.05 significance level.
