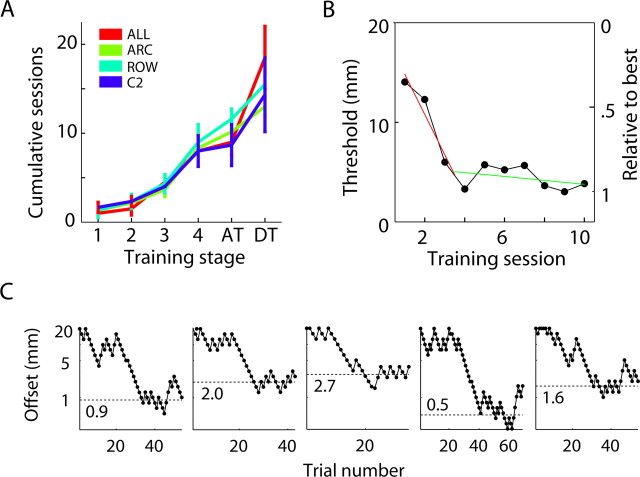
Figure 2.
Procedural and discriminative learning. A, Cumulative number of training sessions required for rats to successfully complete procedural training and the association (AT) and discrimination (DT) stages. DT indicates the cumulative number of training sessions rats were exposed to before being tested with only discrimination trials. B, Example of a learning curve illustrating the transient (red) and steady-state (green) performance during training. The right axis indicates the performance threshold relative to the best threshold attained by the same rat. C, Examples of session staircases (5 different rats). Each dot is a single trial; downward movement of the curve indicates success, and upward movement indicates an incorrect choice in the preceding trial. Dotted lines (and the numbers next to them) indicate the estimated threshold (Te) for the same session.

