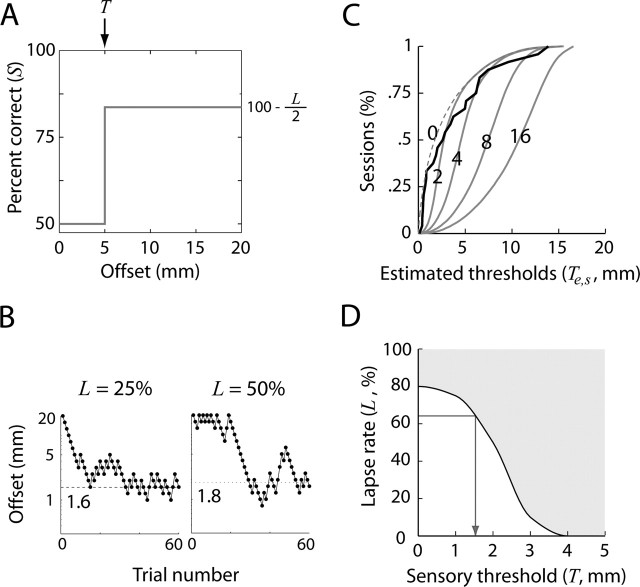
Figure 3.
Performance model. A, Localization performance was modeled with a simple approximation of an observer with a particular sensory threshold (T) and a fixed rate of lapsing (L). See Materials and Methods, Psychophysical thresholds. B, Typical staircases generated by the performance model in A with different values for L (25 or 50%). The dotted line and number indicate the threshold estimated from the smoothed, simulated staircase (Ts; 15 bin boxcar filter). C, Ts was estimated from staircases such as those in B generated by the performance model in A. By repeating the simulation for a given combination of T and L, a distribution of Ts could be drawn. Gray lines depict CDFs of Ts generated by the model when T was 0, 2, 4, 8, or 16 mm and L was 65%. Solid gray lines indicate CDFs of Te given different values of T that were significantly larger than the CDF of Te (black line; p < 0.05). The dashed line indicates a CDF that was not significantly larger than the CDF of Te. Numbers indicate T for each CDF. D, The values of T that generated distributions of Ts > Te depended on L; larger L generated higher values for Te for a particular value of T. The shaded region above the curve includes combinations of T and L that yielded distributions of Ts > Te (p < 0.05). Given the value of Le obtained empirically, the lowest T in the shaded area was used as an approximation of the real sensory threshold (arrow).

