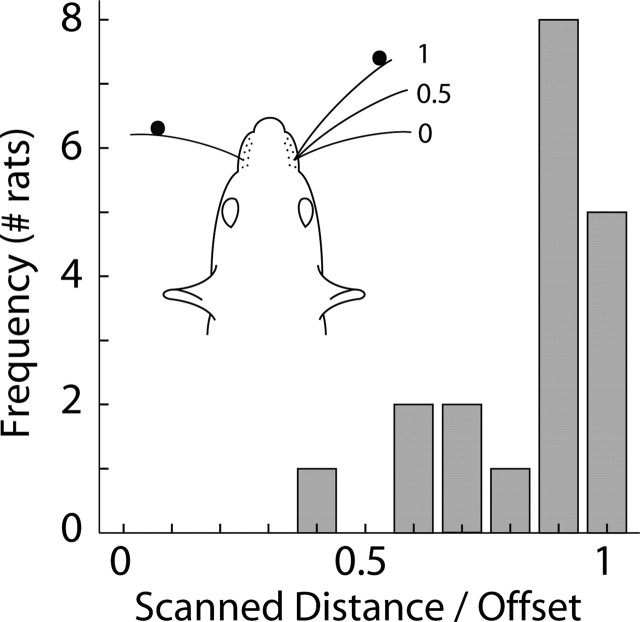
Figure 7.
Horizontal region scanned between poles. A histogram of the ratio of the distance whiskers scanned beyond the location of the pedestal (0 mm) and the location of the anterior pole (> 0 mm; averages of different rats) is shown. An area was considered scanned if a whisker at any time moved through it during a trial. Thus, if the anterior pole was placed 20 mm behind the posterior pole and a whisker moved up to within 10 mm of the anterior pole, 50% of the horizontal gap between the poles was considered scanned (0.5 in the histogram). All tracked trials were included (n = 19 rats, 9 groups). Rats with all whiskers intact (ALL) were not included, because a significant proportion of the whiskers were not tracked.

