
Figure 1.
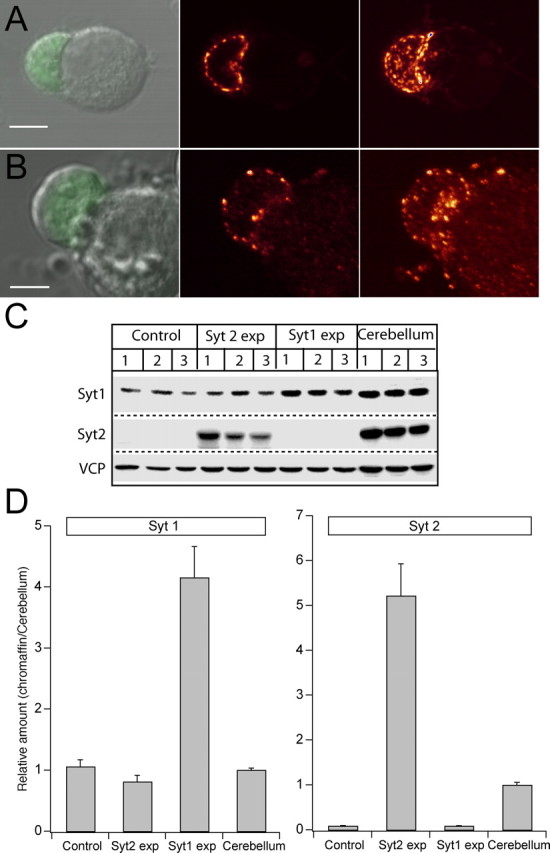
Viral overexpression of synaptotagmin 1 and 2 in chromaffin cells. A, B, Left column, Differential interference contrast image of chromaffin cells from Syt1 null chromaffin cells overlaid with the image obtained in the green channel, indicating EGFP fluorescence. In both cases, the leftmost cell expresses the viral construct at relatively low levels, whereas the right cell does not express. Scale bars, 5 μm. Middle column, Confocal section through the equatorial plane of the cell showing the preferential localization of vesicles to the periphery of the cell. Right column, Projection image of the maximal intensity of a confocal z-stack until the x-y plane. The apparently diffusely located vesicles in the bottom image are attributable to outgrowth of processes by the expressing cell. C, Western blot of lysates from three different preparations of control bovine chromaffin cells, Syt2- and Syt1-expressing chromaffin cells, and cerebellum. VCP was included as an internal standard. D, Quantification of expression level of Syt1 (left) and Syt2 (right) from the Western blot in C, after correction for infection efficiency and normalization to VCP intensity. Overexpression of Syt1 increased the protein concentration to approximately fourfold the value in uninfected bovine chromaffin cells. Chromaffin cells did not express Syt2 before viral infection, which induced expression at approximately five times the level in cerebellum.