
Figure 1.
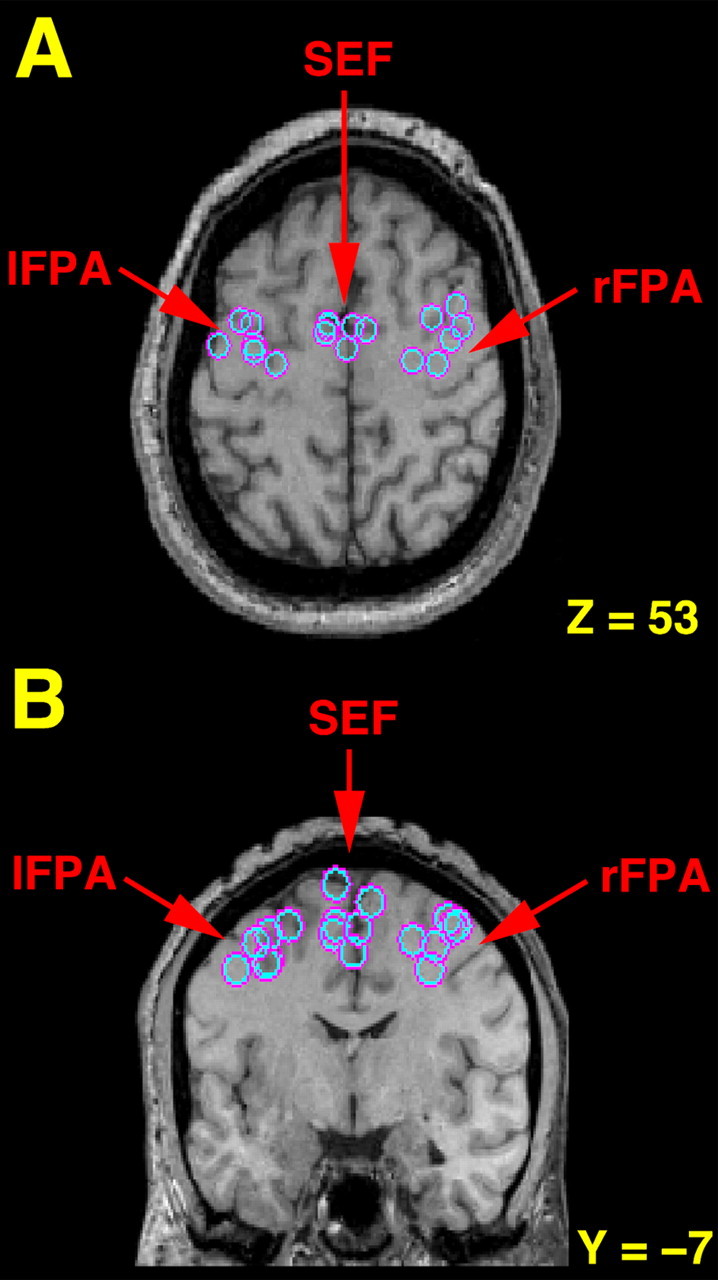
Transverse (A) and coronal (B) sections illustrating the location for each subject (n = 6) of the lFPA, rFPA, and SEF as determined by fMRI comparing smooth pursuit to fixation. The left hemisphere is shown on the left side of each image. The locations are superimposed on a single subject's MRI, which has been transformed into standard Talairach space. For illustrative purposes, the horizontal slice (z = 53) was selected based on the average z coordinates of activation for the FPA and SEF as determined by fMRI. The coronal section (y =–7) was selected based on the average y coordinates of activation for the FPA and SEF. Note that the greatest activity in the FPA was consistently found at or near the junction of the superior frontal and precentral sulci (A) and that increased activity in the SEF was regularly found in the medial wall near the paracentral sulcus (B), both established anatomical land marks for these regions in humans (Paus, 1996; Grosbras et al., 1999).