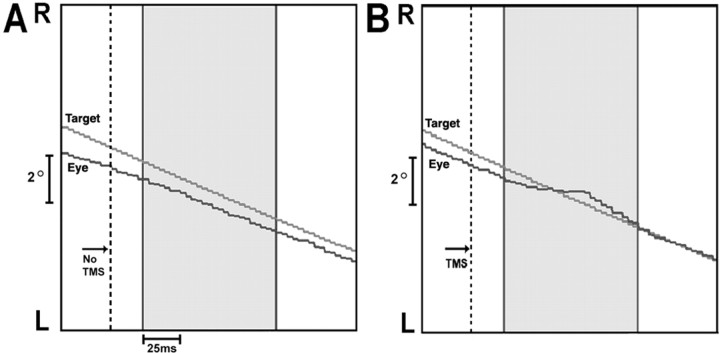
Figure 2.
Experiment 1. The effect of TMS on eye velocity when applied at peak target velocity in one subject. The x-axis is time (milliseconds), and the y-axis is position. The panels depict pursuit at midcycle of a target moving horizontally at 0.4 Hz with a sinusoidal velocity profile across 20° of visual angle. The dotted line indicates the point of peak target velocity, the moment that TMS was applied in B. The gray portion of each panel illustrates the 100 ms analysis window that begins 25 ms after peak target velocity. In A (No TMS), eye velocity is close to target velocity (average eye velocity in window, 23.0°/s; average target velocity, 24.4°/s). In B (TMS of lFPA), eye velocity in the window is reduced (average eye velocity, 20.0°/s; average target velocity, 24.4°/s). R, Right; L, left.

