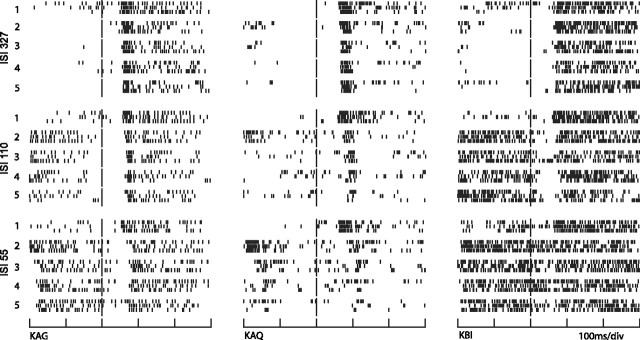
Figure 5.
Spike raster plots for three V4 neurons. The neurons are arranged in three columns. The top group of rasters in each column represents the responses to the first five stimulus cycles in the 327 ms ISI condition. Sequential stimulus onsets within a trial are aligned one beneath the other at the long vertical marks for each condition. The stimulus cycle is denoted by the numbers one to five along the left side. The short vertical tics represent the neural discharges. Only the first three trials for each condition are displayed. The middle and bottom groups represent the responses to the 110 and 55 ms ISI conditions, respectively. On the left, neuron KAG has both transient and sustained response components, KAQ has a predominantly transient response, and on the right neuron KBI has a predominantly sustained response. Suppression of the transient component to successive stimuli is clear for KAG and KAQ. Neural activity preceding the long vertical marks is activity-related mostly to the preceding stimulus and response combination.

