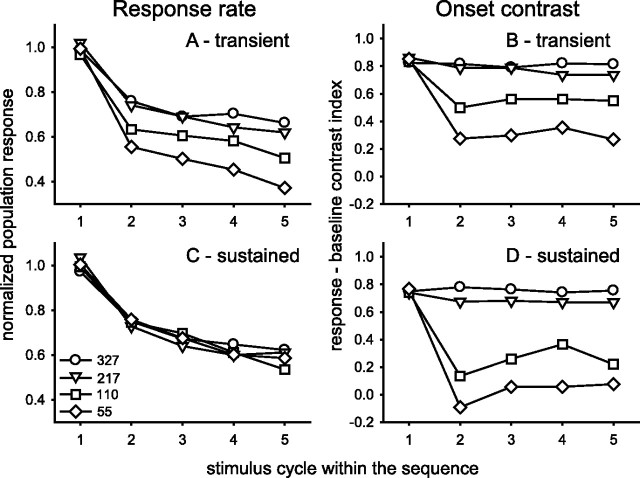
Figure 8.
Response rate and onset contrast for transient and sustained groups. Population response rate in the 50–150 ms interval after stimulus onset is plotted for each ISI condition for transient (A) and sustained (C) groups. Then a major rate change on the first repetition is followed by gradual decline. A differential ISI impact on transient, but not sustained, neurons is evident. Detection of the onset of individual stimulus responses is examined in B, D in terms of a contrast index (Re – Co)/(Re + Co) that compares the response (Re) with the immediately preceding control (Co) activity from the –50 to +50 ms interval surrounding stimulus onset. ISIs on the order of saccade durations result in a dramatically reduced onset contrast for sustained neurons (D), which indicates a continuous signal bridging across the ISI gap. Symbol legend in C defines the ISI conditions for the entire figure.

