Figure 3.
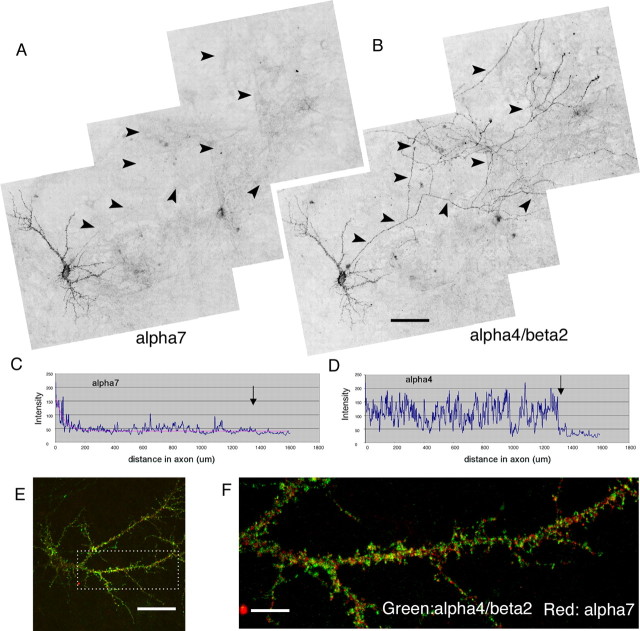
Direct comparisons of surface α7 and α4β2 in the same transfected neuron. A, B, Hippocampal neurons were cotransfected with α7–GFP and HA-tagged α4 and β2 (α4–HA/β2–HA) at 8 DIV. Surface α7 was stained by chicken anti-GFP antibodies, and surface α4β2 was stained by mouse anti-HA antibody at 16 DIV. Neurons were fixed and blocked before incubating with secondary antibody (Alexa 568-labeled goat anti-mouse and Alexa 647-labeled goat anti-chicken antibodies). Images were scanned from the LSM 510 confocal microscope. Pseudocolors were initially applied to represent surface signals of α7 (green) and α4β2 (red) before converting to gray channel. Multiple images were taken from the LSM 510 confocal microscope and were assembled to obtain a larger view. Surface α7 was mostly expressed in soma-dendrites; a faint signal can be detected at initial axonal regions, but it decreased below detection along the axons (A). Surface α4β2 was expressed at both axons and soma-dendrites (B). Arrowheads indicate axon regions. C, D, Intensity line profiles of α7 and α4β2 along axons from the transfected neuron shown in A and B. Arrows mark the start of blank regions. E, F, Neurons were transfected and stained similarly to those in A and B, except that staining was performed at 22 DIV. A neuron expressing both α7–GFP and α4–HA/β2–HA is shown in E. The boxed region from E is enlarged in F. Although α7 and α4β2 were both expressed in somatodendritic compartments, a large fraction of surface clusters from different receptors did not overlap (F). Scale bars: (in B) A, B, 100 μm; E, 30 μm; F, 10 μm.

