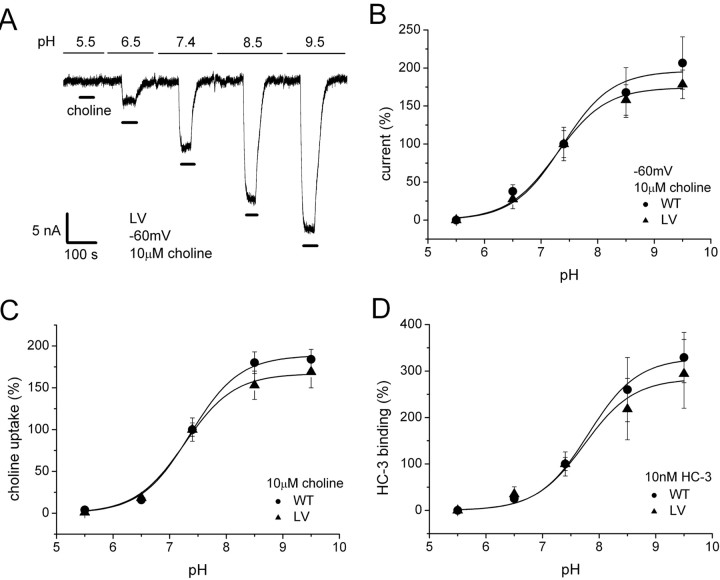
Figure 7.
pH dependence of choline-induced current, choline uptake, and HC-3 binding. A, pH dependence of choline-induced current. Typical data are shown for 10 μm choline-induced current for LV at −60 mV in 100 mm NaCl buffer. The slow baseline drift is removed from the figure. B, pH dependence of 10 μm choline-induced currents at −60 mV are measured for WT and LV (n = 5). The data were normalized to pH 7.4 and fitted to a single-binding-site model. pKa of 7.4 ± 0.1 and I max of 196.3 ± 10.5% for WT. pKa of 7.3 ± 0.1 and I max of 174.4 ± 4.0% for LV. C, pH dependence of choline uptake was measured in 10 μm choline (1% [3H]choline) for 30 min (n = 8). pKa of 7.4 ± 0.1 and V max of 188.8 ± 3.7% for WT. pKa of 7.3 ± 0.1 and V max of 167.0 ± 3.8% for LV. D, pH dependence of HC-3-specific binding was measured in 10 nm [3H]HC-3 for 30 min (n = 6–8). pKa of 7.8 ± 0.1 and maximum binding (B max) of 328.0 ± 10.0% for WT. pKa of 7.7 ± 0.2 and B max of 283.6 ± 17.8% for LV.

