Figure 3.
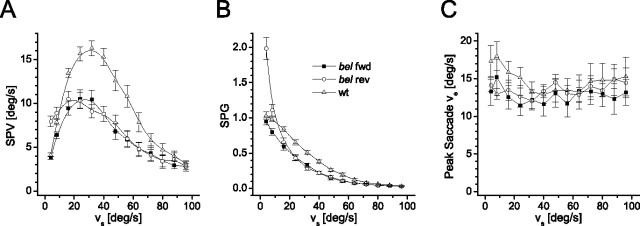
Stimulus velocity challenge of the OKR. A, The course of the SPV versus the stimulus velocity (vs) = 4°/s − 96°/s) for wt (nwt = 18), bel fwd (nbf = 18), and bel rev (nbr = 18) at a stimulus contrast of cs = 100%. B, Same data plotted as slow-phase gain (SPG=SPV/vs). The spatial frequency of the stimulus was 0.045 c/deg, and the stimulus velocity direction alternated every 5 s. Each condition was 30 s, of which only the last 20 s were included in the analysis. C, The peak eye velocity (ve) reached during the saccades in the entire group was similar in all three groups across all stimulus velocities (F(2,32) = 0.638; p = 0.535). Fish that did not generate a single saccade during one or more stimulus velocity conditions could not be included in the analysis (new sample sizes: nwt = 10, nbf = 10, nbr = 15).

