
Figure 10.
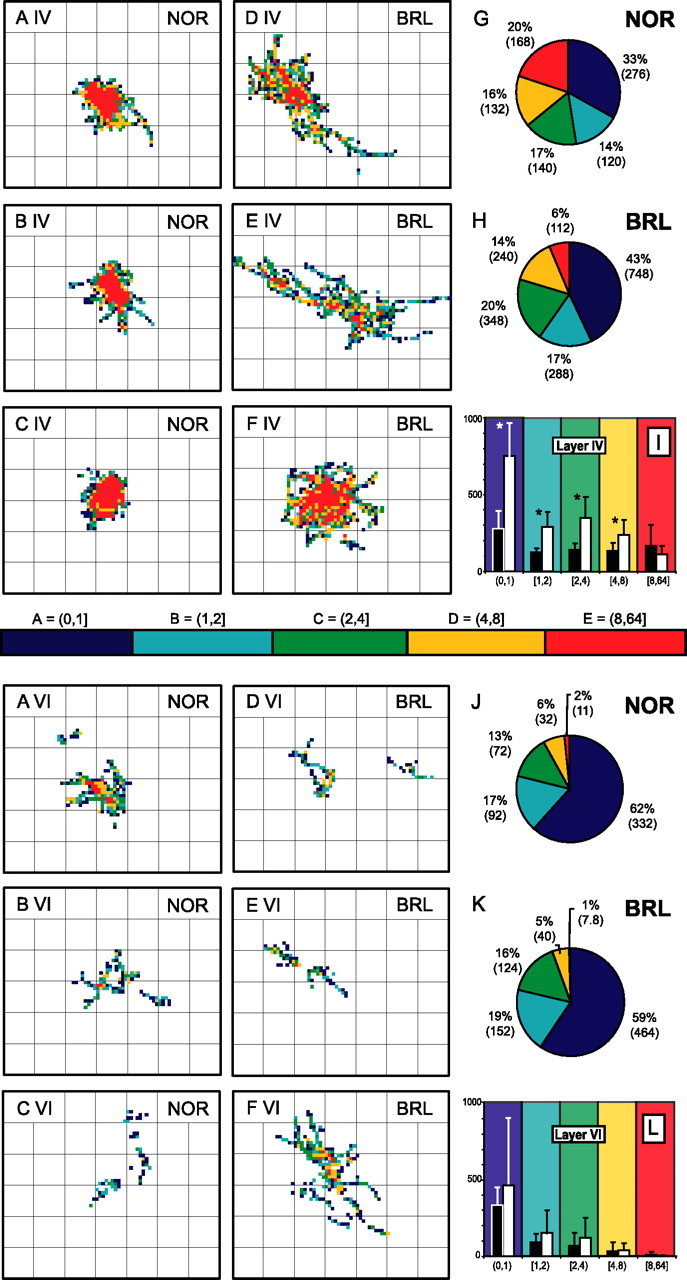
Two-dimensional density plots illustrating tangential distribution of the boutons of NOR and BRL axons within layer IV and VI. For individual axons, the density of boutons was determined separately for the plexus in layer IV and layer VI by calculating the number of boutons per 400 μm2 area of tangential cortical surface. Distributions are displayed on a grid with a line distance of 200 × 200 μm. The color bar gives the coding used for the five density ranges applied. AIV–CIV, Bouton distribution in layer IV of three NOR axons; DIV–FIV, distribution in layer IV of three BRL axons; AVI–CVI, distribution of boutons in layer VI of the NOR axons displayed above; DVI–FVI, distribution in layer VI of the three BRL axons. The pie charts (G, H, J, K) represent the mean percentages of each of the five density ranges as calculated for NOR and BRL plexuses separately. The mean absolute values of the surface areas in 100 μm2 are given in parentheses. These latter values are displayed in the bar graphs (I, L) allowing comparison between strains; the asterisks indicate the significant differences (one-way univariate analysis; p < 0.05). Error bars indicate SD.