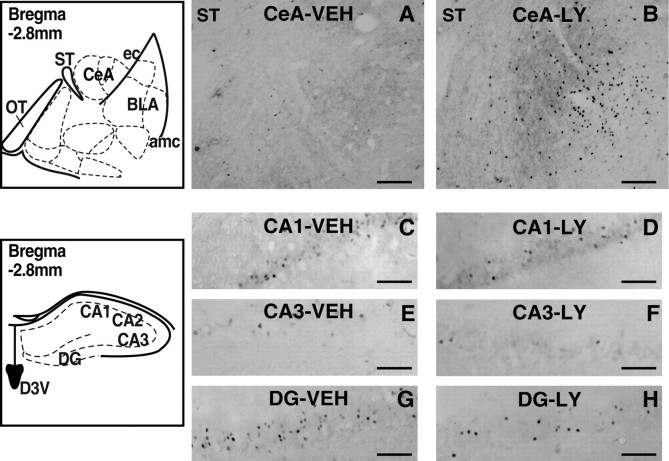
Figure 4.
Photomicrographs and schematic drawings depicting the area of analysis and illustrating typical changes in Fos immunoreactivity within the CeA and hippocampus of an animal treated with either VEH or LY379268 (3 mg/kg). Because LY379268 produced similar changes in Fos immunoreactivity in both the conditioned and stress-induced reinstatement tests (see Fig. 3), photomicrographs from only one test condition (conditioned reinstatement) are shown. A, B, CeA; C, D, CA1; E, F, CA3; G, H, DG. Scale bar, 100 μm. amc, Amygdala capsule; ec, external capsule; ST, stria terminalis.

