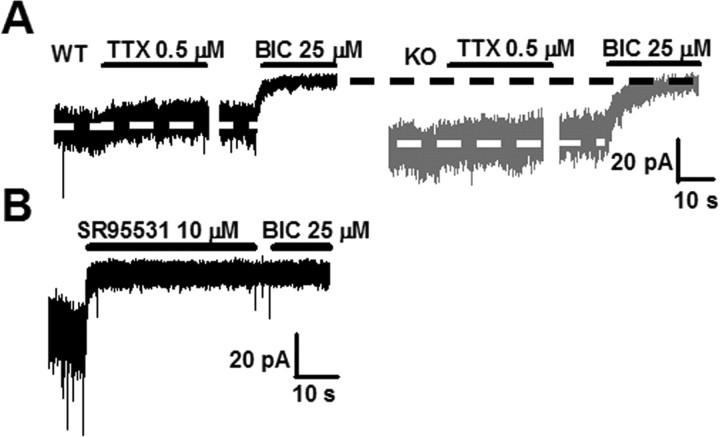
Figure 2.
Increased tonic current in the α1−/− CGCs is not accounted for by increased action potential-dependent vesicular release or nonspecificity of BIC. A, Representative traces showing a slight inhibition of tonic current by TTX (0.5 μm) in +/+ (left, black) and α1−/− (right, gray) slices. The full extent of tonic conductance in these cells can be seen during application of BIC (25 μm). White dotted lines are centered at the mean baseline current in the absence of TTX; a small inward current immediately preceding TTX application is a delivery method artifact. A spontaneous IPSC can be seen in the +/+ trace; in the α1−/−, spontaneous IPSCs are observed but at much lower than +/+ frequency (unpublished observation). The breaks between TTX and BIC applications are not drawn to scale; total duration of TTX application for the WT trace in this panel was 44 s and for the KO trace was 30 s. There were no differences in TTX effect on tonic current between genotypes: +/+, 3.1 ± 0.7 pA, n = 25; −/−, 3.5 ± 1.4 pA, n = 12; p = 0.75. B, Application of the specific GABAA antagonist SR95531 (10 μm) completely blocks tonic current without additional inhibition by BIC as illustrated in this P25 +/+ trace. Not shown is application of SR95531 after BIC without a change of baseline current. Similar results were observed in two other +/+ and three α1−/− cells.

