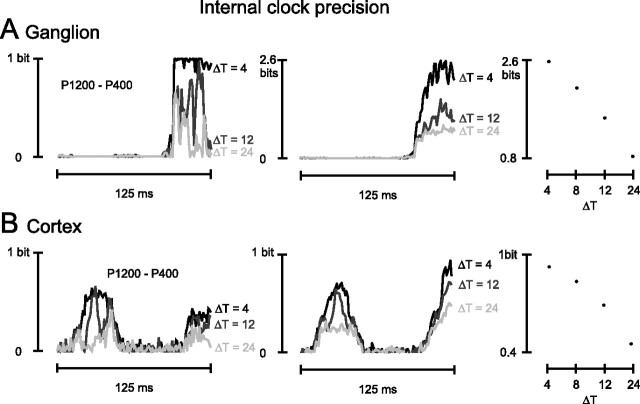
Figure 6.
Effect of internal clock precision on available information. A, Time course of the ganglion cell pattern information about stimulus pair P1200–P400 (left) and the total stimulus set (middle). Each plot refers to a different degree of internal clock precision; ΔTinternal is indicated simply as ΔT. Right, Peak spike pattern information about the total stimulus set as a function of internal clock precision (ΔT). B, Time course of the cortical cell cluster pattern information about the stimulus pair P1200–P400 (left) and the total stimulus set (middle). Conventions are the same as in A. Right, Peak spike pattern information about the total stimulus set as a function of internal clock precision (ΔT).

