
Figure 3.
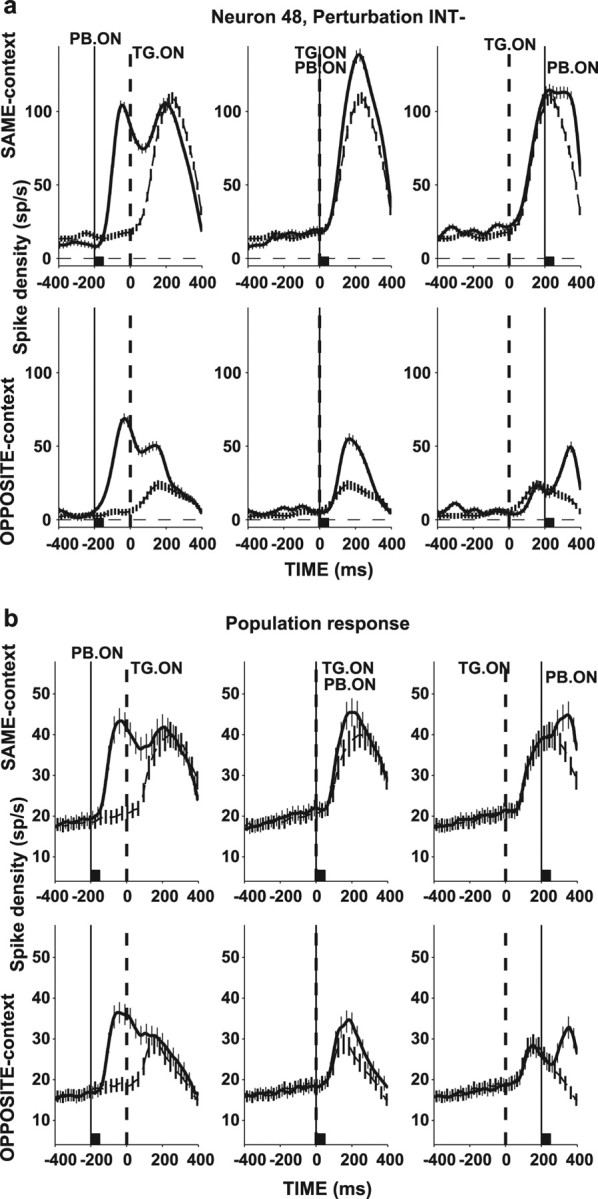
Superposition of search and perturbation-related responses. a, Responses (mean and SE) of a representative neuron for trials in which the perturbation was in the RF (thick traces) and for the corresponding no-perturbation trials (thin dashed traces). Top row shows responses for the SAME context, and bottom row shows responses in the OPPOSITE context, for PTOAs of −200 ms (left), 0 ms (middle), and 200 ms (right). Traces are aligned with target onset (time 0, broken vertical line), and the time of perturbation (INT−) onset is marked with the solid vertical line. The back squares mark the perturbation lifetime. b, Population responses, averaged across all neurons and perturbation types. Same format as in a. TG. ON, Target onset; PB. ON, perturbation onset.