
Figure 4.
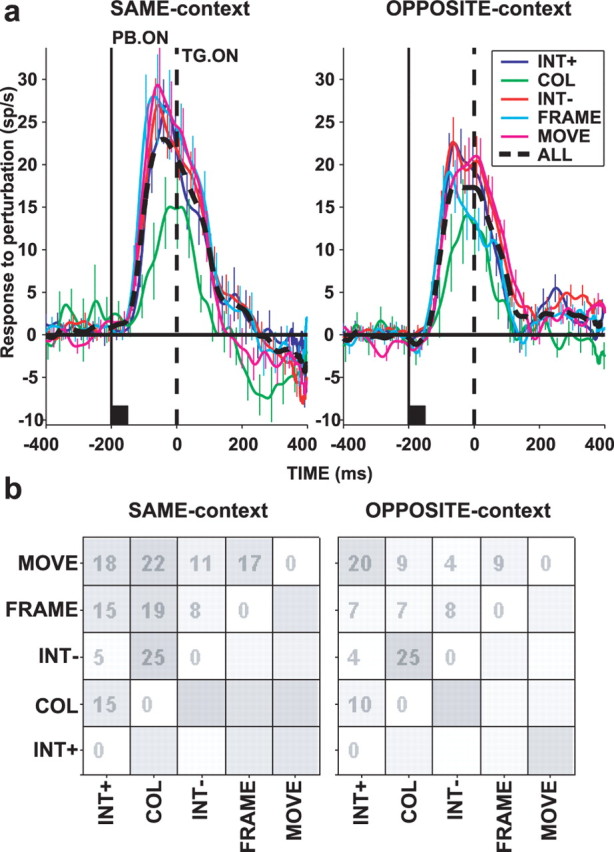
Responses to each perturbation type. a, Population response to perturbations (difference between response on trials with and without perturbation) for PTOA of −200 ms, SAME context (left) and OPPOSITE context (right). The black squares mark the perturbation lifetime. The different types of perturbations are designated as follows: INT+, increase in luminance; INT−, decrease in luminance; COL, color change; MOVE, back-and-forth radial movement; FRAME, appearance of frame surrounding one pattern; ALL, all perturbations together. b, Gray map representing the similarity matrices for SAME context (left) and OPPOSITE context (right). Numbers show the percentage of neurons with statistically significant different responses for each perturbation pair (Kruskal–Wallis ANOVA on perturbation responses 50–250 ms after perturbation onset followed by multiple pairwise comparisons). We used a liberal criterion of 0.05 to ensure that we did not miss any differences that may have occurred. TG. ON, Target onset; PB. ON, perturbation onset.