
Figure 1.
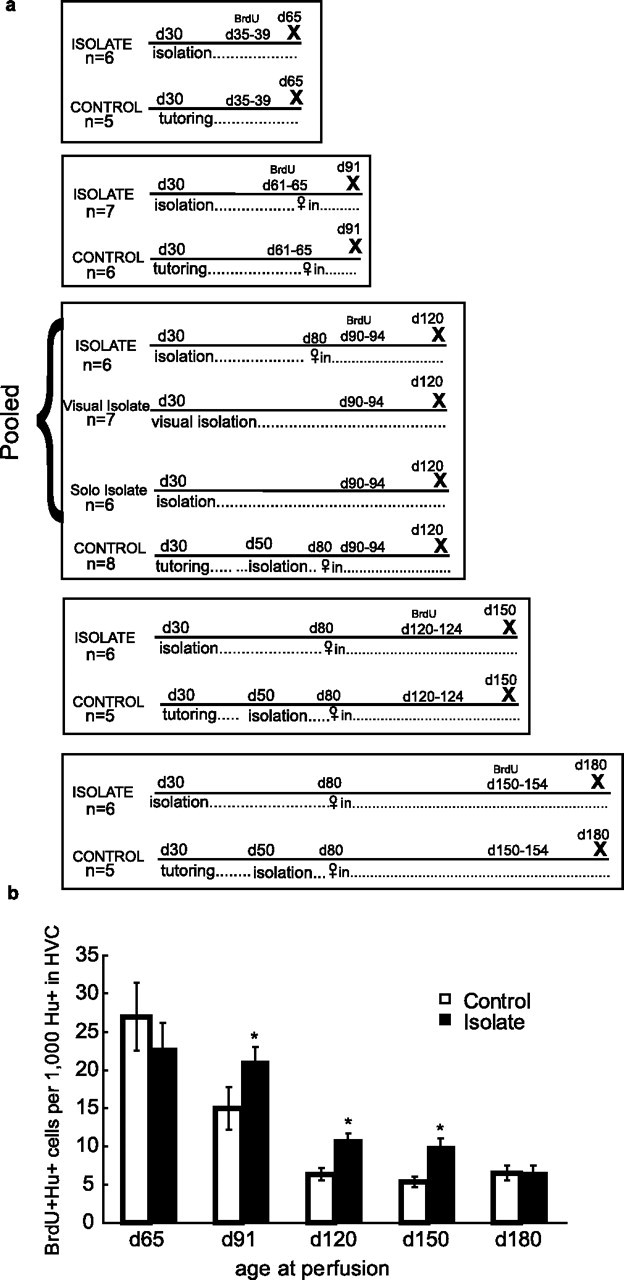
a shows the different conditions under which the groups were housed and when they received BrdU injections. X marks the day of perfusion. b shows new neuron recruitment in isolates and controls. The y-axis shows the number of BrdU-labeled neurons per 1000 HVC neurons 25–30 d after injections. Error bars indicate SEM. The x-axis shows the posthatching day on which animals were killed. In birds killed after day 90, there were more new neurons in the HVC of isolates than in that of controls. This difference was significant for the isolate groups at days 90, 120, and 150 (isolates vs controls, day 65: U = 21, p = 0.33; *day 91: U = 5, p = 0.02; *day 120: U = 19, p = 0.01; *day 150: U = 2, p = 0.02; day 180: U = 16, p = 0.93).