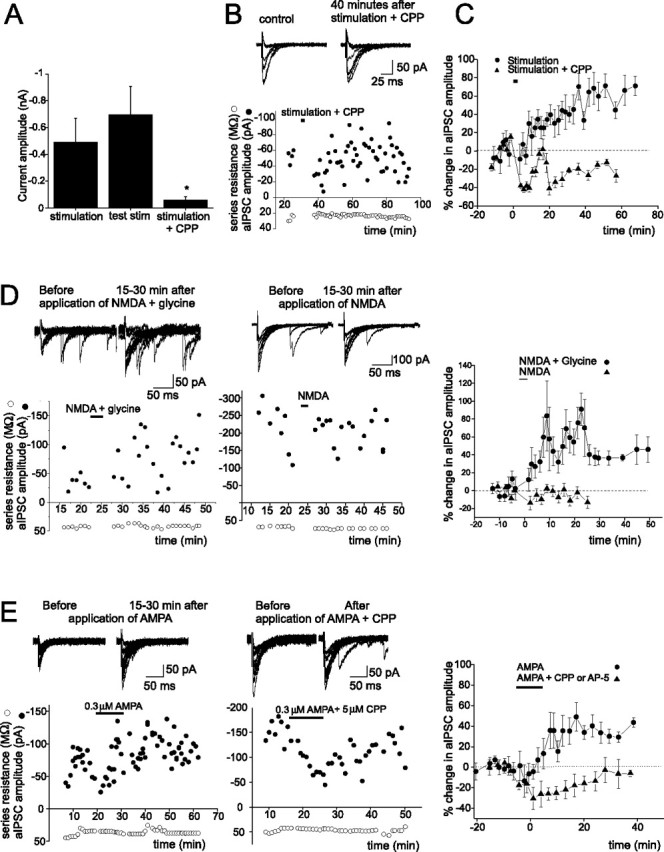
Figure 2.

PF stimulation-induced increase in aIPSC amplitude requires activation of NMDARs. A, Group data of currents evoked by PF stimulation, before (middle; currents were evoked by a single sweep of testing stimulation) and during the application of CPP (right; n = 5, *p < 0.04), and without CPP (left; in experiments described in Fig. 1). B, aIPSC traces (top) and aIPSC amplitude before and after PF stimulation in the presence of an NMDAR blocker (CPP). C, CPP blocks the PF stimulation-induced potentiation of aIPSC amplitudes (n = 6; p < 0.03). D, E, aIPSC traces (top) and the plot of aIPSC amplitude versus time. A plot of percentage change in mean aIPSC amplitudes versus time (right; NMDA plus glycine, n = 7; NMDA, n = 5; p < 0.007; AMPA, n = 7; AMPA plus NMDAR blocker, n = 4; p < 0.03) is shown. Error bars indicate SEM.
