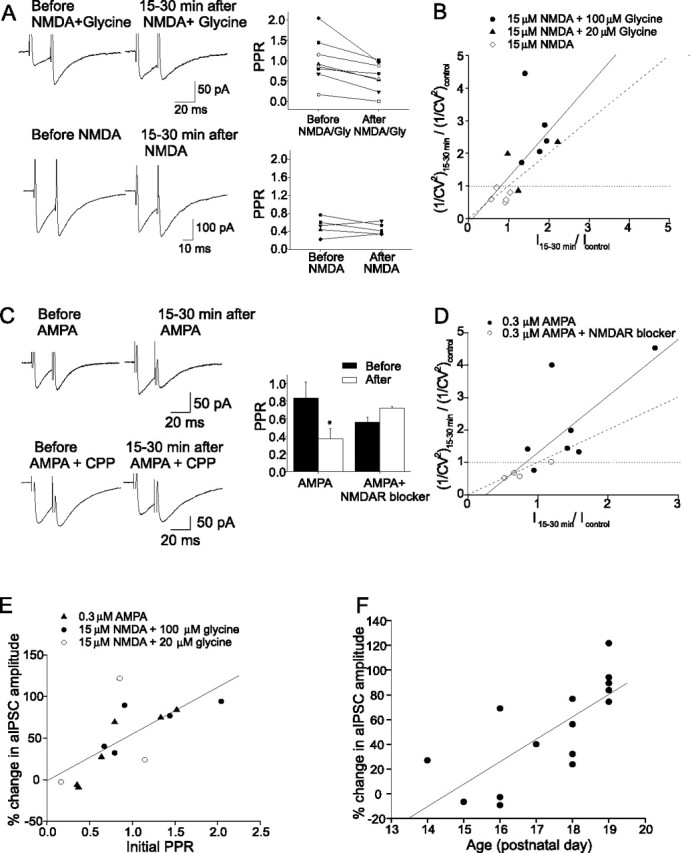
Figure 4.

Presynaptic expression of chemically induced I-LTP. A, aIPSC traces (left) and the PPR of individual cells (right) before and after application of NMDA plus glycine (top) and NMDA (bottom). B, Plot of 1/CV2 versus current amplitude (I). Values of 1/CV2 and I were normalized to their control values before the application of NMDA plus glycine or NMDA. Each symbol represents a separate experiment. There was a significant correlation between the change in 1/CV2 and I (solid line) (r = 0.83; p < 0.003). C, aIPSC traces (left) and average PPR. Mean PPR was significantly reduced after AMPA application (n = 7; *p < 0.05; AMPA plus NMDAR blocker, n = 4). Error bars indicate SEM. D, The AMPA-induced potentiation of aIPSCs was correlated with an increase in 1/CV2 (r = 0.76; p < 0.007). E, Correlation between changes in the aIPSC amplitude 15–30 min after activation of NMDARs and the initial PPR (r = 0.70; p < 0.006). F, Largest potentiation of aIPSC amplitude (with NMDA plus glycine or AMPA) occurred in cells from older animals (r = 0.74; p < 0.002).
