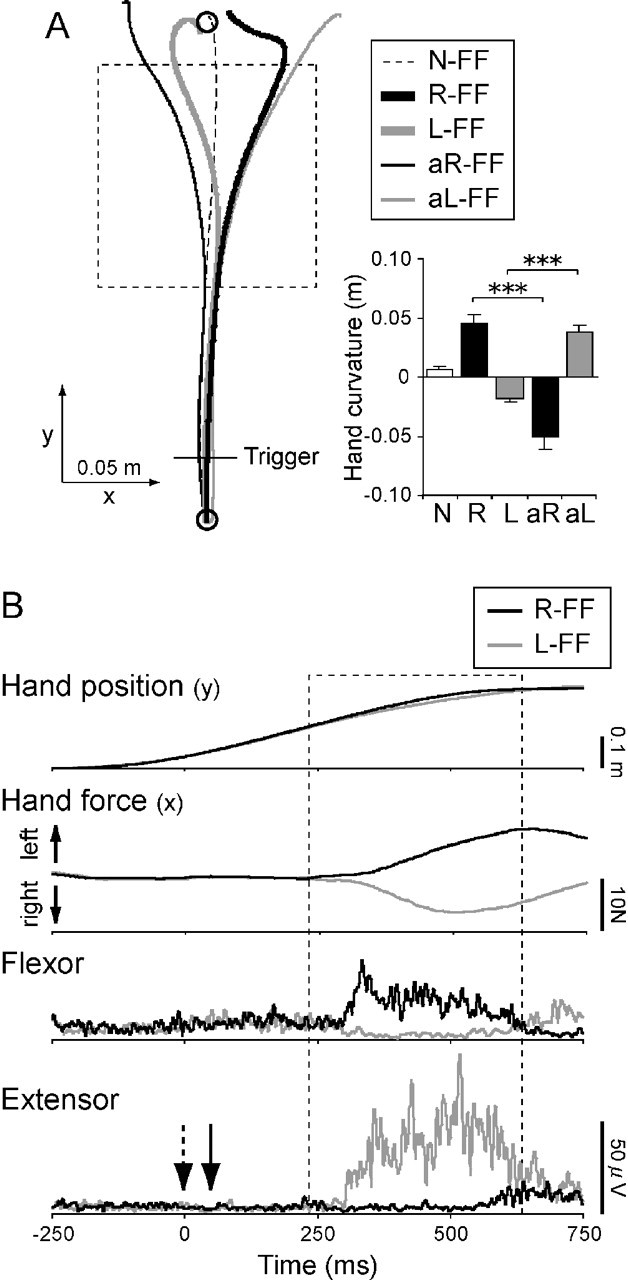
Figure 2.

Movement and EMG patterns with different force fields. A, Typical example of hand trajectories (left panel) and each hand curvature (right panel) in the right/left direction in the normal (N-FF, R-FF, and L-FF) and after-effect (aR-FF and aL-FF) trials with different force fields. The rectangular dashed area is force field location. The traces in the normal trials are the average of 12 trials. The traces in the after-effect trials are the average of 3 trials. In after-effect trials, either direction of force field was unexpectedly removed. Each bar in the right graph represents the mean and SE of hand curvature in the right/left direction for each condition. The asterisks express a significant difference between the normal and after-effect trials for each field (***p < 0.001). B, An example of the hand position profiles in the y-axis direction, the hand force profiles in the x-axis direction (upward is left direction), and the EMG waveforms in the shoulder flexor and extensor muscles during arm movements in the R-FF (black line) and L-FF (gray line) conditions. The data show results from a typical subject in baseline conditions with neither perturbation nor TMS. Each trace is the average of 12 trials. The rectangular dashed area denotes the force field period. Time 0 corresponds to a position trigger (0.03 m from the start position) shown in Figure 2A. The downward arrows in the bottom graph represent the time at which transcranial magnetic stimulation (dashed arrow) and perturbation (solid arrow) would be applied in other conditions as appropriate. Note that the muscle activity before the arm encountered the force fields was almost same between the R-FF and L-FF conditions.
