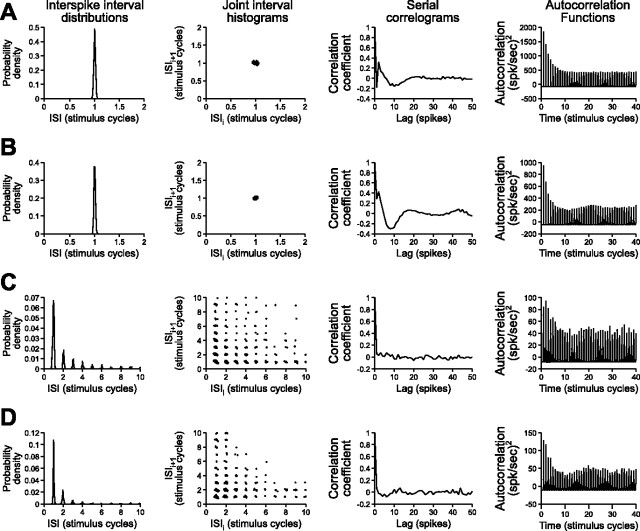
Figure 6.
Patterns of activity in model neurons and primary sensory afferents during random modulations of their preferred stimulus feature, including interspike interval (ISI) distributions, joint interval histograms (plots of interspike interval against the preceding interspike interval), serial correlograms (correlations between the interspike intervals of spikes separated by various delays, or lags), and autocorrelation functions (probabilities of spike occurrence as a function of time after a spike at time = 0). The time bases and intervals are normalized to the duration of the stimulus carrier cycle for comparison. A, Model time-coding neuron with a low threshold (Vth = 0.7 mV) and low noise term (σn = 0.05 mV) during random PM stimulation (σPM = 15°). B, T-unit during random PM stimulation (σPM = 15°). C, Model amplitude-coding neuron with a high threshold (Vth = 4.6 mV) and large noise term (σn = 0.25 mV) during random AM stimulation (σAM = 20%). D, P-unit during random AM stimulation (σAM = 20%).

