
Figure 9.
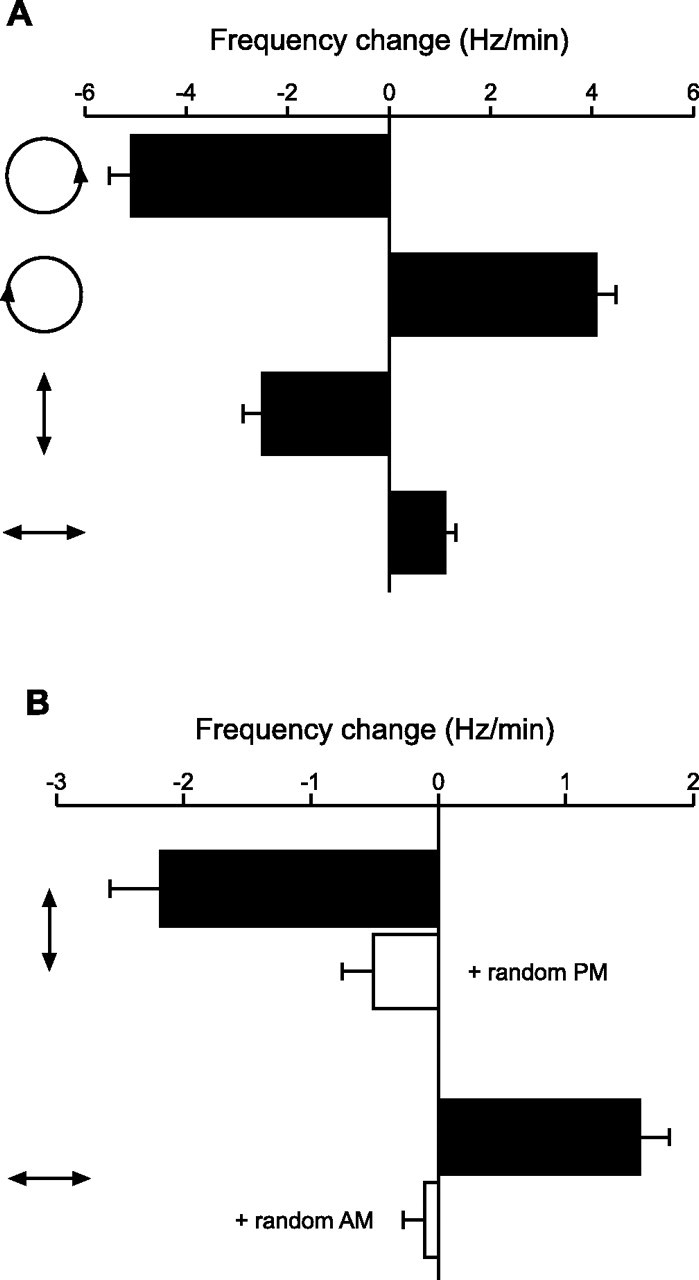
Shifts in EOD frequency in response to sinusoidal stimulus modulations. A, Changes in EOD frequency in response to Df > 0, Df < 0, sinusoidal AM, and sinusoidal PM (mean ± SEM; n = 22). Icons to the left show Lissajous plots of the stimulus modulations (AM plotted against PM, after Fig. 7A). B, Changes in EOD frequency in response to sinusoidal AM, with and without random PM, and sinusoidal PM, with and without random AM (mean ± SEM; n = 8). Icons to the left show Lissajous plots of the sinusoidal stimulus modulations. Note the difference in scaling between A and B, which is attributable to the relatively stronger responses to Df > 0 and Df < 0 compared with the responses to AM and PM.