Figure 7.

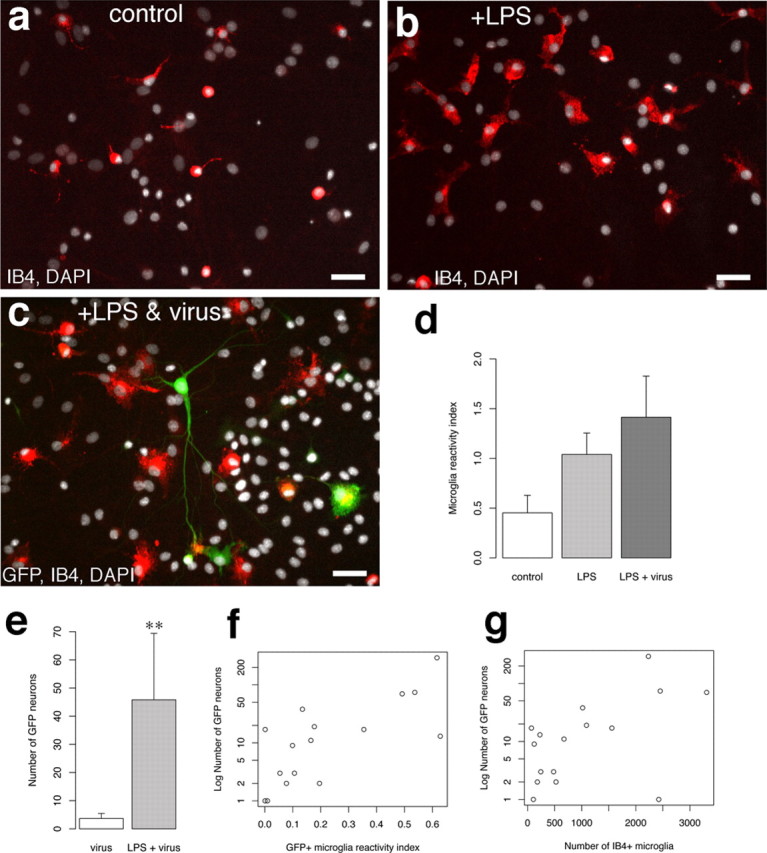
Activation of microglia increases the incidence of retrovirally labeled neurons and fusion. a, Image of IB4-positive microglia from an untreated primary cortical cell culture. Notice that the microglia cell bodies are small and round with occasional ramified processes extending from the soma. b, IB4-positive microglia from a culture that was incubated with the known microglia cell activator LPS (1 μg/ml). Notice that the IB4+ cells now have a large soma with ameboid appearance, a characteristic of activated microglia. c, A GFP+ neuron from a culture that received LPS and GFP retrovirus. The GFP+ neuron has a GFP+/IB4+ microglia fused to its primary dendrite. Notice the IB4+ microglia with large, ameboid cell bodies nearby. d, Index of IB4 labeling in LPS, LPS plus virus, and control cultures. The reactivity index is the average number of IB4+ cells for each condition expressed as a fraction of the total average IB4+ population for all conditions. e, Average number of GFP+ neurons in virus alone and LPS plus virus cultures. **p = 0.00375, Mann–Whitney U test. f, Plot of number of GFP neurons per culture (n = 16) with respect to the index of IB4+/GFP+ cell reactivity (number of IB4+/GFP+ microglia divided by number of total IB4+ cells). g, Plot of number of GFP neurons per culture with respect to the total number of IB4+ cells per culture. Scale bars: a–c, 40 μm.
