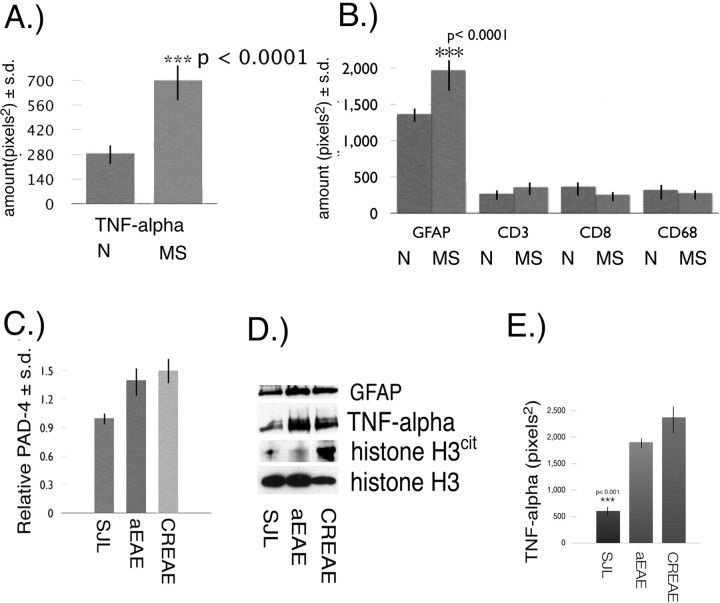
Figure 3.
TNF-α and cytological markers in MS NAWM. A, Quantitation of TNF-α ± SD in white matter from normal (N) (n = 8) and NAWM from MS patients (n = 17) by immunoslot blot. B, Quantitation ± SD of GFAP, CD3, CD8, and CD68 levels in normal (N) white matter and MS NAWM. C, Relative amount of PAD4 ± SD in brain nuclear fractions from SJL, aEAE, and CREAE mice. D, Western blot of whole-brain proteins from SJL, aEAE, and CREAE mice with anti-GFAP, anti-TNF-α, anti-histone H3cit, and anti-histone H3. E, Amount of TNF-α ± SD (p < 0.001) in 5 μg of total brain proteins from SJL, aEAE, and CREAE mice.

