
Figure 5.
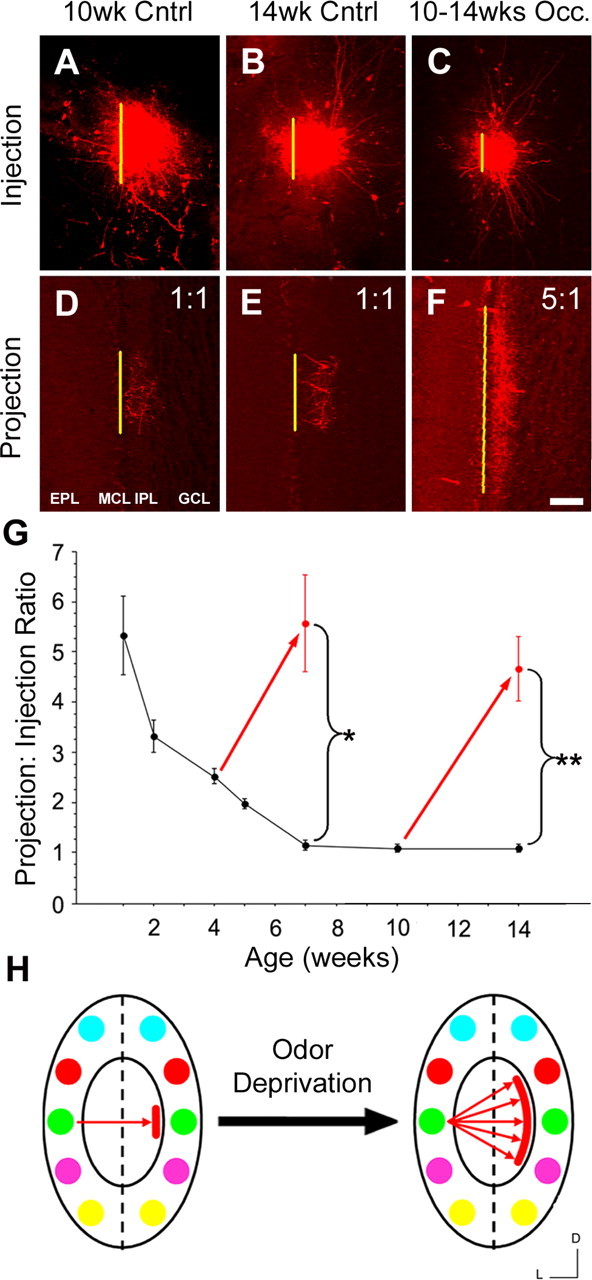
Activity is required to maintain the intrabulbar map. Testing the effect of odorant-deprivation on the mature map. A–C, Olfactory bulb tracer injections performed on olfactory bulbs of mature mice at 10 weeks (A) and 14 weeks (B) of age and animals occluded (Occ.) from PNW-10 to PNW-14 (C). D–F, Projection sites corresponding to A–C, respectively, indicate a clear broadening of projections in the occluded mice (F) compared with projections from either control mice (D, E), demonstrating intrabulbar map plasticity after maturity. MCL, Mitral cell layer; GCL, granule cell layer. Scale bar, 100 μm. G, Graph showing the effect of odorant deprivation on the development and maintenance of the intrabulbar map. Red arrows represent the effect of naris occlusion in two experimental groups: mice blocked from PNW-4 to PNW-7 (5.9 ± 1.1; n = 5) and PNW-10 to PNW-14 (4.7 ± 0.6; n = 4). Error bars represent ± SD. Graph illustrates that both groups show a significant increase in their average projection to injection ratio (*p < 0.001, t = 24.89; **p < 0.001, t = 33.48), demonstrating clear activity-dependent plasticity with no critical period. H, Schematic shows that blocking odorant-induced activity results in dramatic broadening of the projection site regardless of the initial maturation state of the map when odorant deprivation begins. D, Dorsal; L, lateral.