
Figure 8.
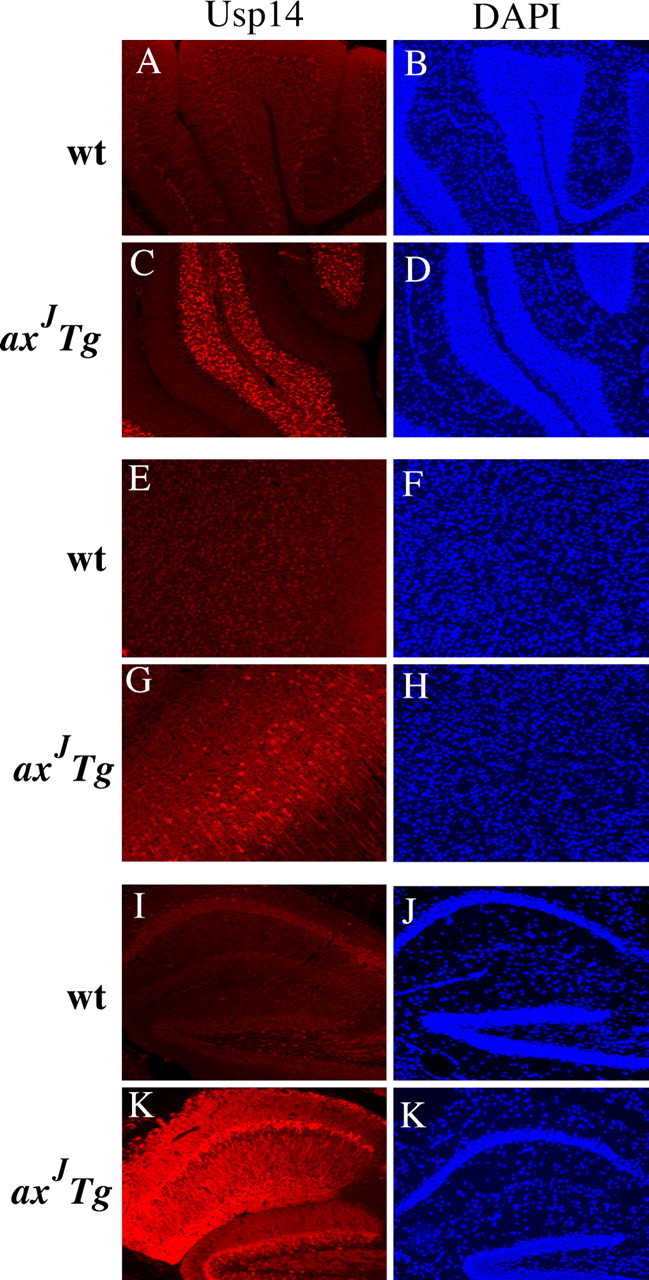
Expression patterns of Thy1-Usp14LF in the CNS. Shown is Usp14 (red) staining in the cerebellum (A, C), cortex (E, G), and hippocampus (I, K) of wild-type (wt) and axJ Tg mice. Endogenous Usp14 is not detected in wild-type tissues. DAPI staining in the cerebellum (B, D), cortex (F, H), and hippocampus (J, L) is shown in blue. Images were taken at 20× magnification.