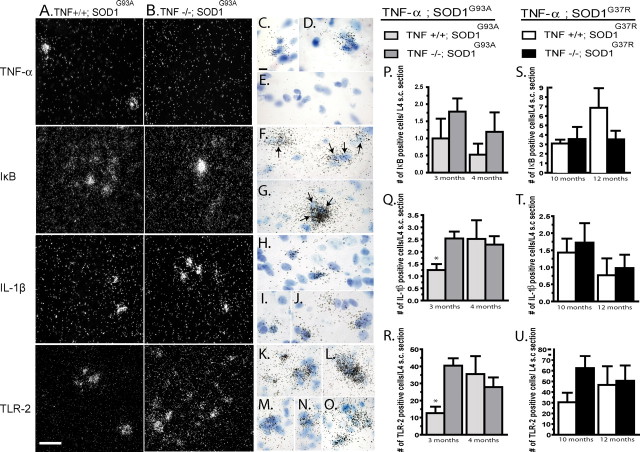
Figure 3.
mRNA expression and quantification of proinflammatory molecules in SOD1 mice with or without TNF-α. In situ hybridization for TNF-α, IκBα, IL-1β, and TLR-2 in TNF-α+/+; SOD1G93A (A) and TNF-α−/−; SOD1G93A (B); 40× magnification. Scale bar, 50 μm (dark-field photomicrographs). Bright-field photomicrographs of TNF-α (C–E), IκBα (F, G), IL-1β (H–J), and TLR-2 (K–O) for TNF-α+/+; SOD1G93A (C, D; F, H; K, L) and for TNF-α−/−; SOD1G93A (E, G, I, J, M–O); 100× magnification. Scale bar, 25 μm. No TNF-α could be detected in TNF-α knock-out mice (B) compared with control (A). Quantification of IκBα (P, S), IL-1β (Q, T), and TLR-2 (R, U) at early symptomatic and end stage of disease in TNF-α+/+; SOD1 transgenic mice and TNF-α−/−; SOD1 mice. No significant difference in the expression of IκBα was detected in SOD1 mice in the absence of TNF-α (P, S). A significant increase in the mRNA expression of IL-1β (Q) (p = 0.02) and TLR-2 (R) (p = 0.01) was observed in TNF-α−/−; SOD1G93A mice compared with TNF-α+/+; SOD1G93A mice at early symptomatic but not at end stage of disease. IL-1β (T) and TLR-2 (U) hybridization signals were not significantly different in mice of SOD1G37R background. Error bars correspond to SEM. * indicates a significant difference between groups. n = 5–7 mice per group. Arrows indicate IκBα-positive cells.

