
Figure 8.
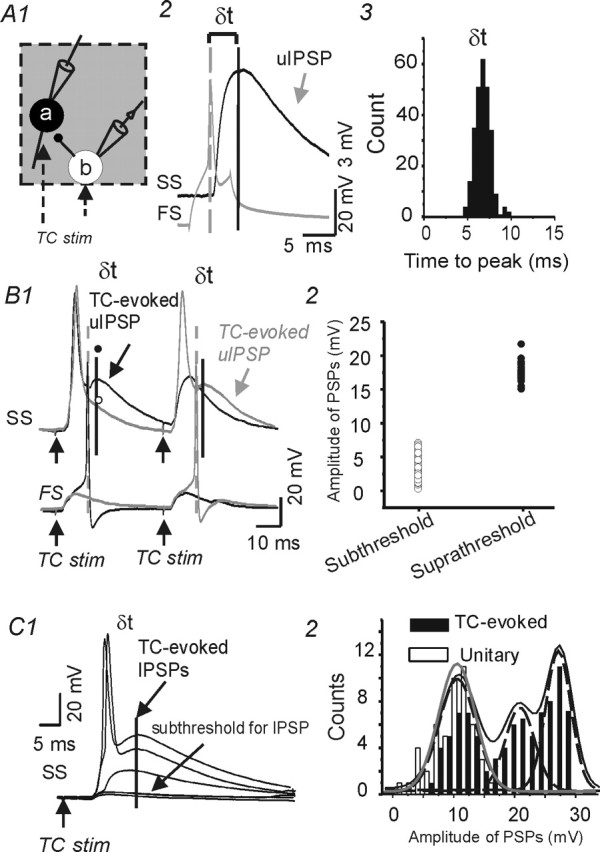
Unitary disynaptic feedforward inhibition from FS interneurons onto spiny stellate neurons. A1, Diagram showing sites of paired recordings from a synaptically connected FS neuron (b) and an SS cell (a) in the same barrel structure (gray square). Extracellular stimuli in the thalamocortical radiation (dotted arrows) excited cells a and b and evoked APs in cell b that elicited feedforward uIPSCs in cell a. A2, Single action potential (bottom gray trace) in presynaptic FS neuron evoked a uIPSP (top black trace) in a postsynaptic SS cell. Vertical dashed and dark lines mark the peaks of the action potential and uIPSP, respectively. δt, Time from peak of presynaptic action potential to the peak of uIPSP. ECl ≈ −32 mV. A3, Histogram showing δt distribution for the FS–SS pair. The long and variable latency to the IPSP peak is attributable to the slow rising slope of the uIPSP in this current-clamp recording. B1, Current-clamp recording from the cell pair of A showing responses evoked by two consecutive pairs of TC stimuli. In the first trial (black traces of FS and SS recordings), the first, but not the second TC stimulus, evoked APs in both the SS (top trace) and FS neuron (bottom). The peak of a depolarizing PSP in the SS cell (solid line and arrow, TC-evoked uIPSP) occurred ∼6 ms after the peak of the FS action potential (dashed line). In the second trial (gray traces), the first TC stimulus evoked an AP in the SS, but not the FS cell, whereas the second stimulus evoked APs in both cells and a depolarizing PSP ∼6 ms after the FS cell action potential. B2, Distribution of amplitudes for the TC-evoked feedforward PSPs in the SS neuron of B1. The two groups were selected based on whether TC stimulus evoked responses that were subthreshold (open circles) or suprathreshold (filled circles) for APs in the FS neuron. C, Representative recording from a spiny neuron showing that graded TC stimulation (100–200 μA) could evoke stepwise increases in feedforward inhibition. The weakest stimuli evoked only monosynaptic EPSPs that were subthreshold for APs and IPSPs (bottom 2 traces). As the stimulus intensity was increased, both early monosynaptic and late disynaptic responses were augmented. The late response, a presumed feedforward depolarizing IPSP, showed stepwise increases in amplitude (top 2 traces). C2, Amplitude distributions of TC-evoked late IPSPs from experiment in C1 (black bars) and uIPSPs recorded in the same neuron (white bars). The TC–IPSP responses were fitted by the sum (black line) of three individual Gaussian curves (dashed lines), with mean amplitudes of 10.2, 22, and 26 mV. A single Gaussian distribution (gray line; mean, 10.2 mV) was fitted to the uIPSP distribution. stim, Stimulus.