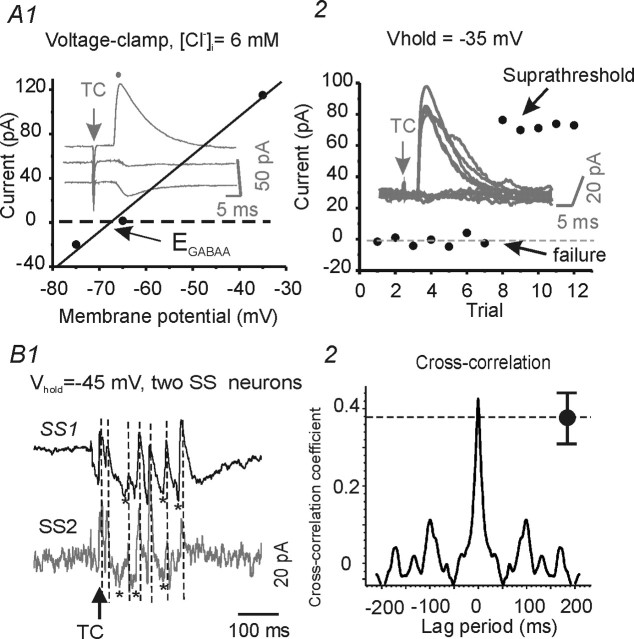
Figure 9.
TC-evoked inhibitory inputs onto spiny neurons in layer IV barrel. A1, Voltage-clamp recordings of TC-evoked putative disynaptic IPSCs. Plot of peak IPSC amplitude versus Vhold (−75, −65, −35 mV; solid circles and line) in an SS neuron. Arrow, Estimated EGABAA = −68 mV. Dashed line, Zero current. A2, Subthreshold and suprathreshold TC stimulus-evoked putative disynaptic all-or-none IPSCs in another SS neuron (Vhold = −35 mV; ECl = −68 mV). B1, Voltage-clamp recordings from two SS neurons in the same barrel showing polysynaptic inhibitory (outward) and excitatory (inward) currents evoked by a strong TC stimulus (Vhold = −45 mV; ECl = −68 mV). Asterisks mark the occurrence of EPSCs and vertical dashed lines mark peaks of IPSPs that are approximately synchronous in the two cells. B2, Cross-correlation analysis of the polysynaptic responses in cells SS1 and SS2 of B1. Filled black circle, Mean cross-correlation coefficient at time 0 obtained from trials in six similar spiny neuronal pairs.

