
Figure 2.
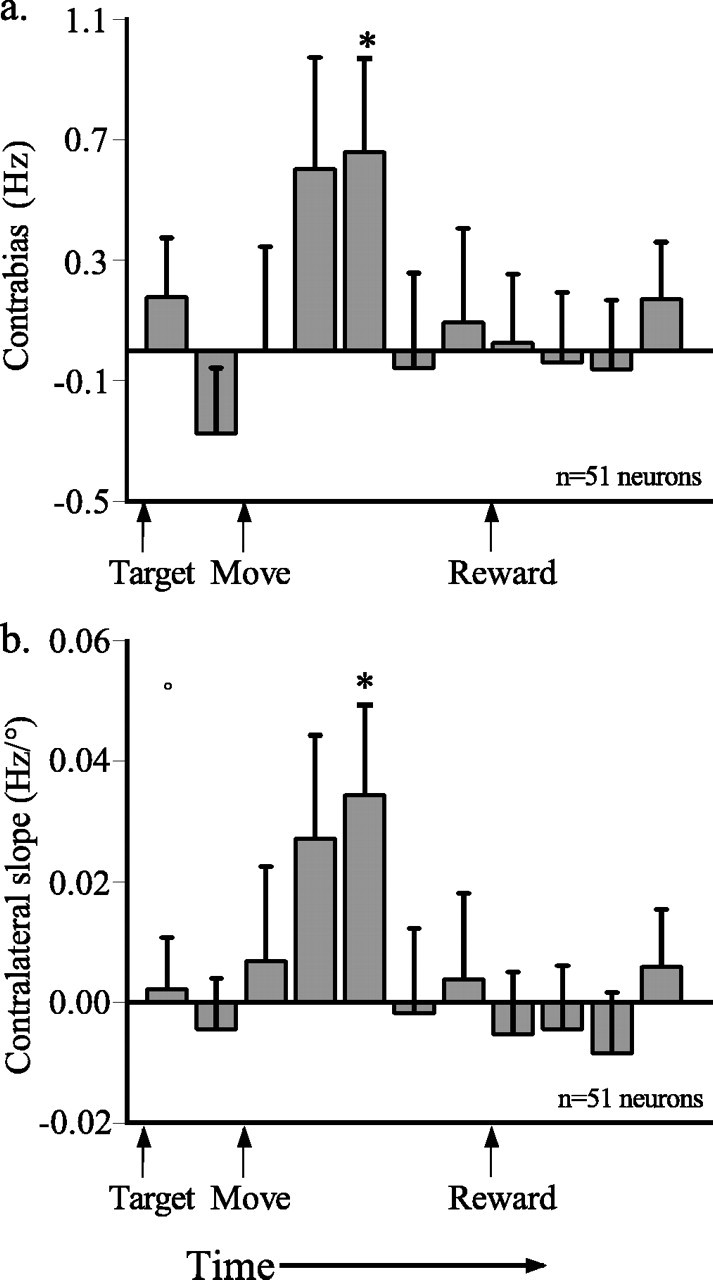
Spatial and temporal properties of responses to saccades initiated from the central fixation stimulus. a, Average differences in firing rate for trials with contralateral and ipsilateral targets (contrabias) plotted as a function of time for 11 200-ms epochs aligned on trial events. b, Mean ± SE slopes of lines fit to response versus target position plot for the same 200 ms epochs. Positive slopes indicate a greater neuronal response on trials in which the target appeared in the hemifield contralateral to the recording site. Significant differences between firing rates for each fixation are indicated by t test at *p < 0.05.