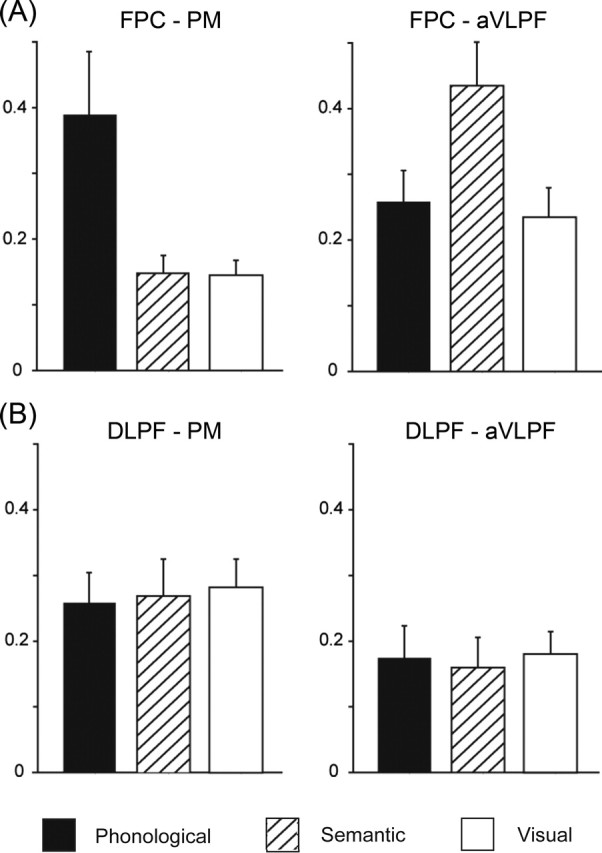
Figure 3.

Inter-regional interaction during the instruction delay. A, Correlation of signals between the FPC and PM (left) and between the FPC and aVLPF (right). B, Correlation of signals between the DLPF and PM (left) and between the DLPF and aVLPF (right). The across-subject means of the normalized correlation coefficients r values are plotted separately for the three task conditions.
